Molecular markers
FISH overview
Editorial Board Member: Mario L. Marques-Piubelli, M.D.
Deputy Editor-in-Chief: Patricia Tsang, M.D., M.B.A.


Last author update: 9 July 2024
Last staff update: 9 July 2024
Copyright: 2003-2025, PathologyOutlines.com, Inc.
PubMed Search: Fluorescence in situ hybridization (FISH)

Table of Contents
Definition / general | Essential features | Terminology | ICD coding | Types of ISH | ISH probes | Specimen types | Applications | Cell enrichment methods | Interpretation of ISH signals | Advantages versus limitations of fluorescence and brightfield ISH | Uses by pathologists | Molecular / cytogenetics images | Sample FISH report | Board review style question #1 | Board review style answer #1 | Board review style question #2 | Board review style answer #2Cite this page: Caramelo A, Polónia A. FISH overview. PathologyOutlines.com website. https://www.pathologyoutlines.com/topic/molecularpathfishgeneral.html. Accessed April 2nd, 2025.
Definition / general
- Detection of specific nucleic acid sequences (DNA / RNA)
- Use of a labeled complementary nucleic acid probe
- Visualization in the cell or tissue (in situ) on a slide by fluorescent microscopy
Essential features
- Detection of specific nucleic acid sequences (DNA / RNA) (foreign or native)
- Visualization of signals in the cell or tissue (in situ) by either digital imaging or manual microscopy
- Detection of numerical chromosome abnormalities (congenital or acquired aneuploidies)
- Detection of amplification / deletion / chromosomal translocation
Terminology
- ISH: in situ hybridization
- FISH: fluorescence in situ hybridization
- BISH: brightfield in situ hybridization
- SISH: silver in situ hybridization
- CISH: chromogenic in situ hybridization
- DDISH: dual hapten dual probe in situ hybridization
- PCR: polymerase chain reaction
ICD coding
- ICD-10: Q90 - Q99 - chromosomal abnormalities, not elsewhere classified
Types of ISH
- Fluorescence ISH (FISH): direct detection of a fluorescent labeled probe
- Brightfield ISH (BISH): indirect detection through an enzymatic reaction
- Silver ISH: detection of silver precipitation (black dots)
- Chromogenic ISH (CISH): detection of chromogen (e.g., red)
- Dual hapten dual probe ISH (DDISH): CISH + SISH
- Hybrid techniques
- Specific to allele PCR - FISH (Nat Protoc 2007;2:2782, Nat Methods 2008;5:877)
- Padlock probes with in situ rolling circle amplification (RCA) (Nat Methods 2010;7:395, Science 1994;265:2085)
ISH probes
- Large chromosome sequences (e.g., large regions, short arm, long arm)
- Repetitive sequences (e.g., centromeres)
- Unique sequences (e.g., specific genes, parts of genes)
Specimen types
- Cells in culture
- Paraffin block sections
- Aspirate smears
- Tissue imprints
- Liquid based preparations
Applications
- Interphase cytogenetics (analysis of chromosomes in nondividing cells)
- Detection of numerical chromosome abnormalities (congenital or acquired aneuploidies)
- Detection of gene amplification (e.g., HER2 in breast / gastric / colorectal / endometrial cancer) (Arch Pathol Lab Med 2023;147:993, Arch Pathol Lab Med 2016;140:1345, Lancet Oncol 2016;17:738, Int J Gynecol Pathol 2021;40:17)
- Detection of gene or chromosomal deletion (e.g., TP53 deletion on chromosome 17p in myeloid neoplasms)
- Detection of chromosomal translocation (e.g., ALK translocation on lung cancer) (Arch Pathol Lab Med 2020 May 13 [Epub ahead of print], Arch Pathol Lab Med 2018;142:321)
- Detection of gene translocation and amplification (e.g., MYC)
- Detection of gene translocation (e.g., cyclin D1)
- Detection of gene translocation (e.g., PML::RARA)
- Viral infections: detection of viral genome (e.g., EBV, HPV, HIV, fungal species)
- Gene expression: detection of messenger RNA for various peptides (e.g., immunoglobulin light chains, albumin)
- Single transcript analysis: detection of point mutations, single nucleotide polymorphisms (SNPs), RNA edited transcripts, tissue specific allele expression, alternative splicing
Cell enrichment methods
- Objective: increase sensitivity of ISH for detection of cytogenetic abnormalities
- Technique: based on physical properties (size, deformability, density) and expression of specific surface antigens
- Applications: plasma cells in bone marrow, circulating tumor cells in blood samples (Arch Pathol Lab Med 2013;137:625, PLoS One 2020;15:e0237308, J Hematol Oncol 2019;12:48)
Interpretation of ISH signals
- Presence of signals (e.g., presence of EBER in EBV infection)
- Gain of signals (e.g., ERBB2 amplification in breast / gastric / colorectal / endometrial cancer)
- Breast cancer (Arch Pathol Lab Med 2023;147:993)
- ISH group 1: HER2/CEP17 ratio ≥ 2.0 and average HER2 copy number ≥ 4.0 signals/cell
- ISH group 2: HER2/CEP17 ratio ≥ 2.0 and average HER2 copy number < 4.0 signals/cell
- ISH group 3: HER2/CEP17 ratio < 2.0 and average HER2 copy number ≥ 6.0 signals/cell
- ISH group 4: HER2/CEP17 ratio < 2.0 and average HER2 copy number ≥ 4.0 and < 6.0 signals/cell
- ISH group 5: HER2/CEP17 ratio < 2.0 and average HER2 copy number < 4.0 signals/cell
- Gastric cancer (Arch Pathol Lab Med 2016;140:1345)
- HER2 positive if HER2/CEP17 ratio ≥ 2.0 or HER2/CEP17 < 2.0 and average HER2 copy number ≥ 6.0 signals/cell
- Colorectal cancer (Lancet Oncol 2016;17:738)
- HER2 positive if HER2/CEP17 ratio ≥ 2.0 in ≥ 50% of cells
- Endometrial cancer (Int J Gynecol Pathol 2021;40:17)
- HER2 positive if HER2/CEP17 ratio ≥ 2.0
- Breast cancer (Arch Pathol Lab Med 2023;147:993)
- Loss of signals (e.g., loss of 1p / 19q in oligodendroglioma)
- Positioning of signals
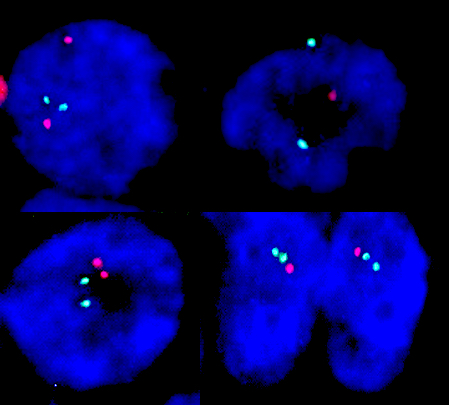
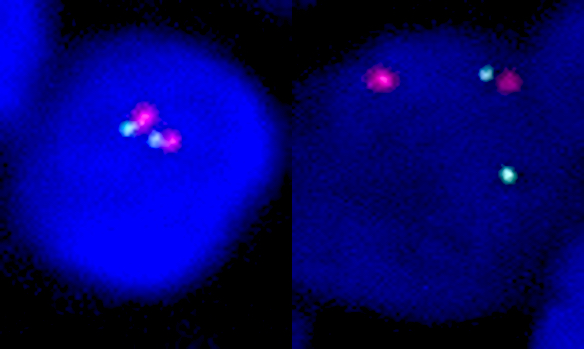
- Break apart probe: neighboring signals altered when detected at a distance, resulting in 2 separate color signals (e.g., EWSR1 translocation)
- Normally, 2 different color signals (red and green) are located nearby, sometimes creating a fused color (yellow); the abnormality exists if the 2 signals are separated
- Fusion probes: distant signals altered when detected nearby, resulting in overlap or juxtaposition of the 2 different color signals (e.g., EWSR1::FLI1 fusion)
- Normally, 2 different color signals (red and green) are separated; the abnormality exists if the 2 signals are together, sometimes creating a fused color (yellow)
- Break apart probe: neighboring signals altered when detected at a distance, resulting in 2 separate color signals (e.g., EWSR1 translocation)
Advantages versus limitations of fluorescence and brightfield ISH
- FISH requires fluorescence microscope (higher cost) versus brightfield ISH requires light microscope (lower cost)
- Higher multiplexing in FISH (> 2 probes) versus low multiplexing in brightfield ISH (≤ 2 probes)
- Low morphologic correlation in FISH versus high morphologic correlation in brightfield ISH
- Loss of signals with time in FISH slides (photographic record mandatory) versus permanent staining in brightfield ISH slides
- Reference: Diagn Pathol 2008;3:41
Uses by pathologists
- See Applications
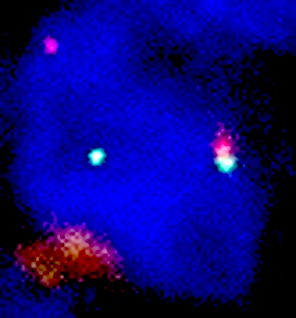
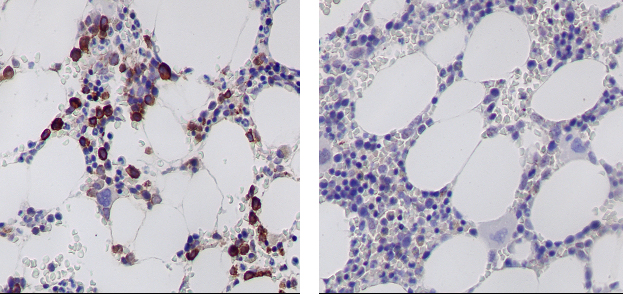
Molecular / cytogenetics images
Contributed by António Polónia, M.D., Ph.D., Ana Caramelo, B.Sc., Ana Ribeiro, M.D.,
Catarina Eloy, M.D., João Vale, M.Sc. and Leica Microsystems, Biosystems division
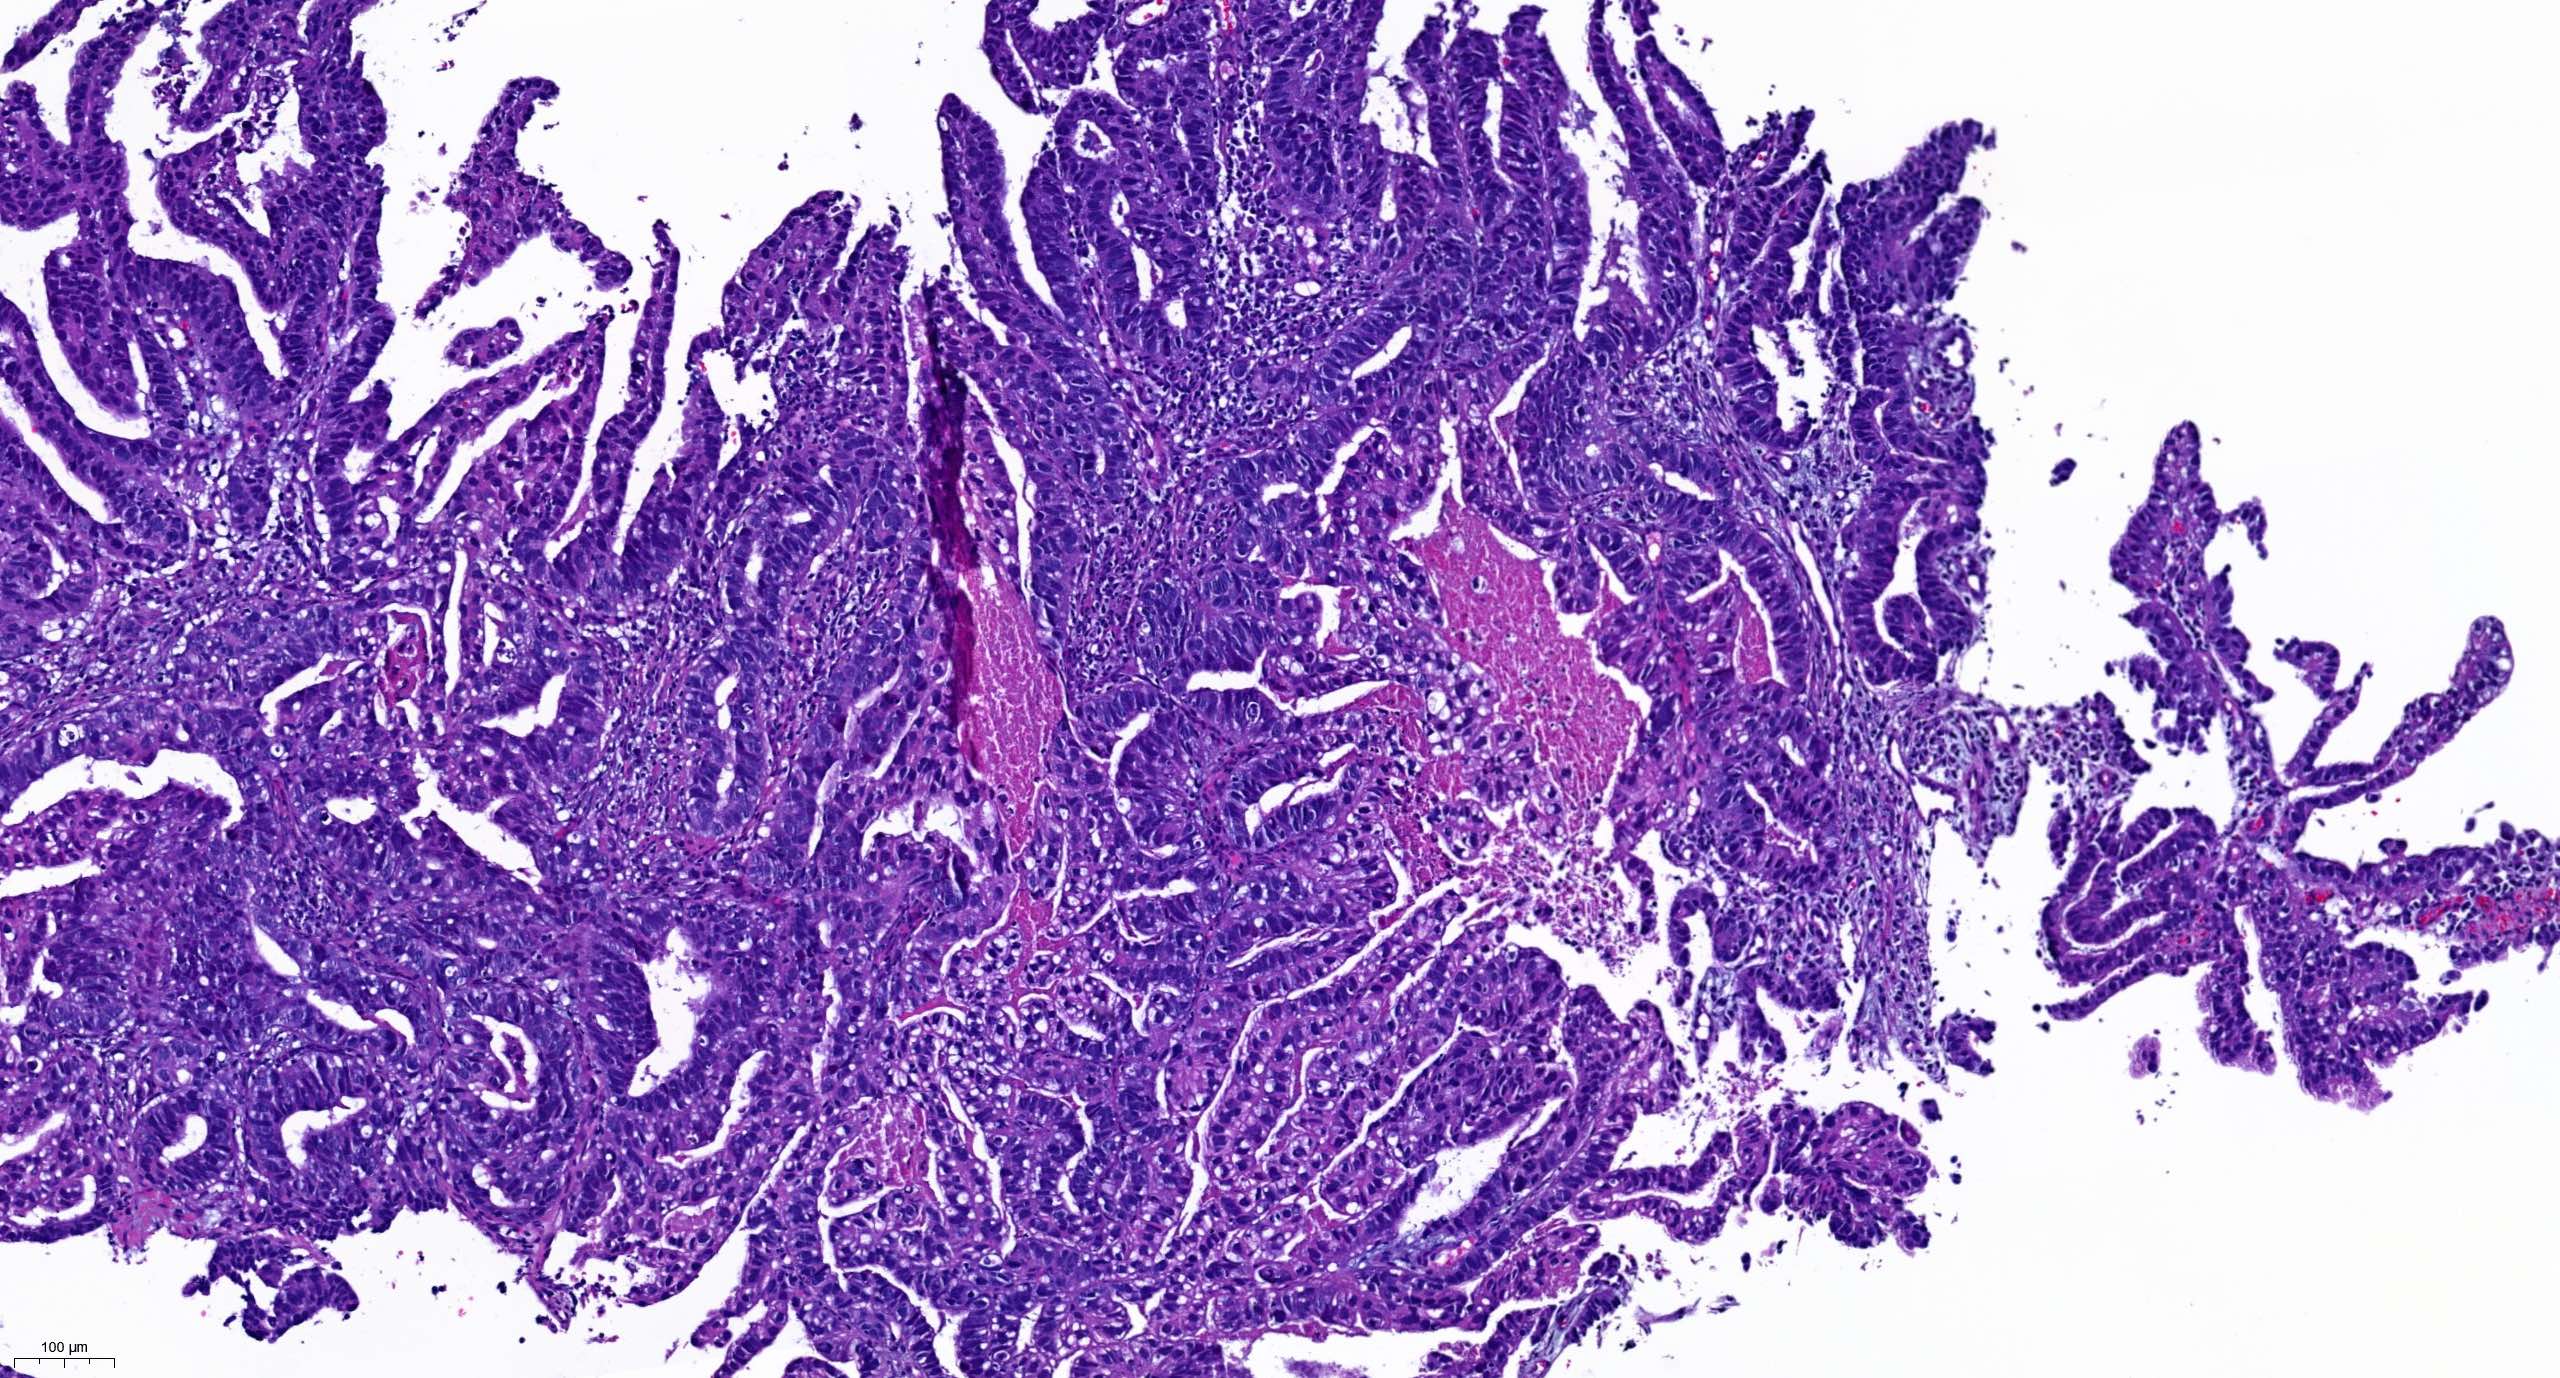
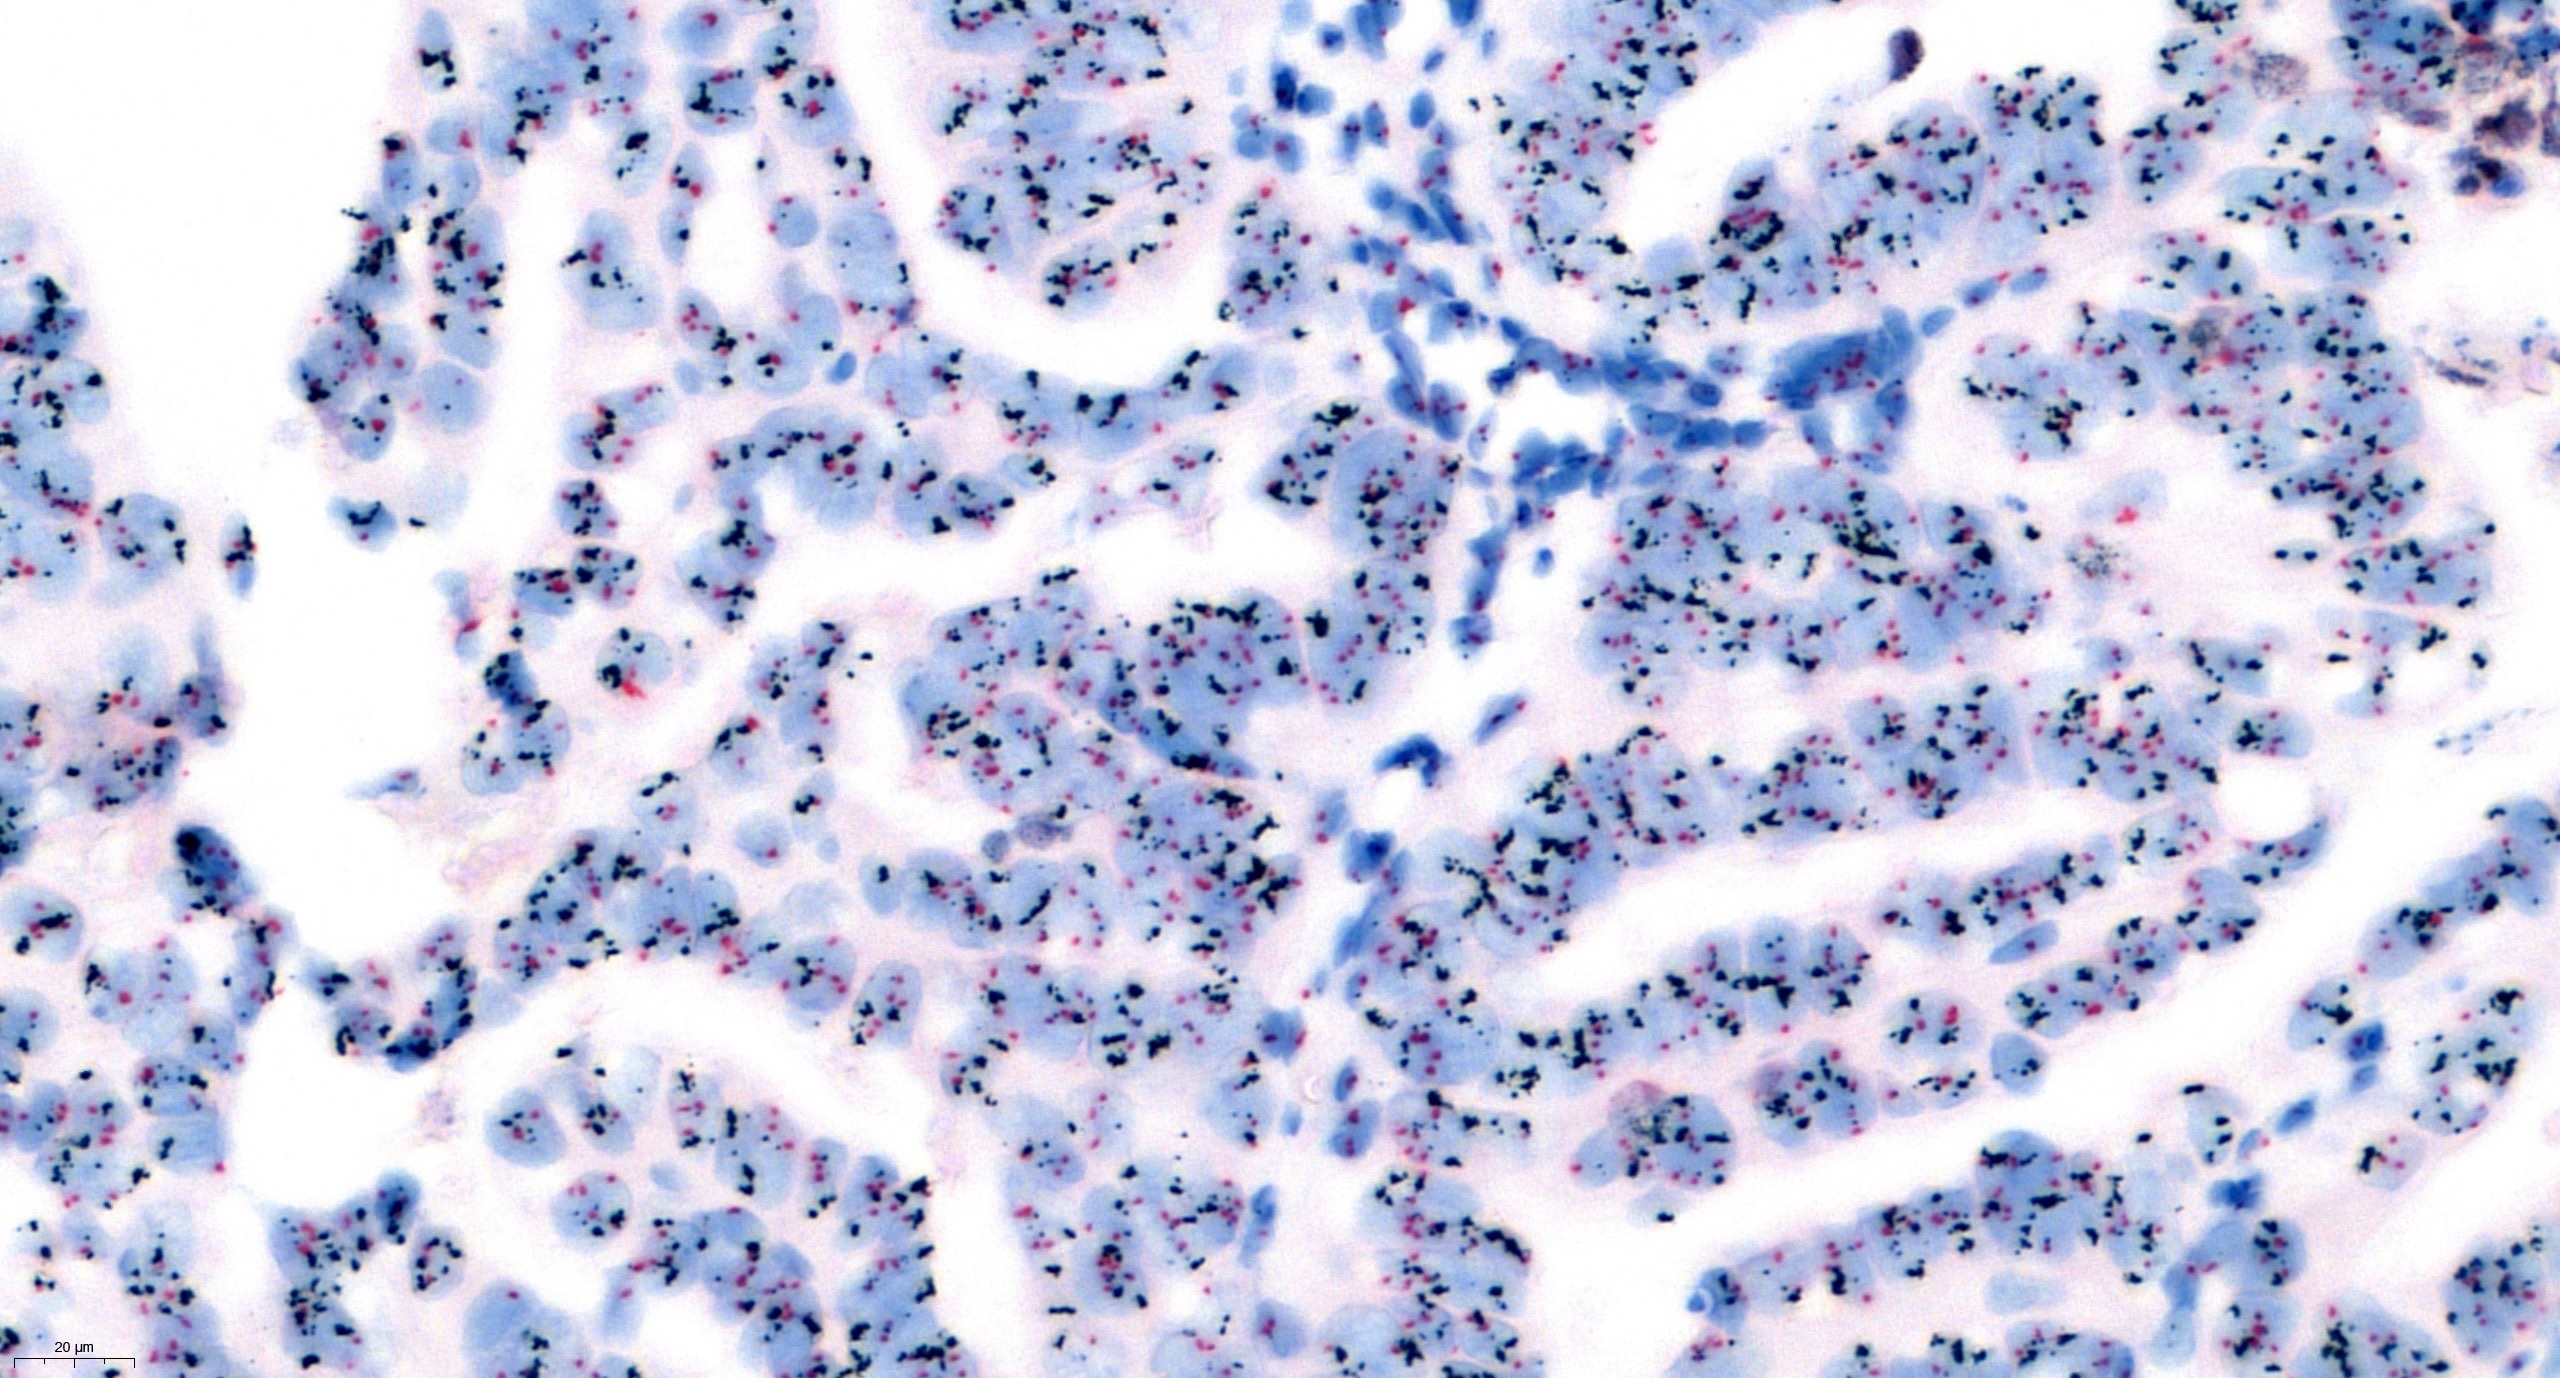
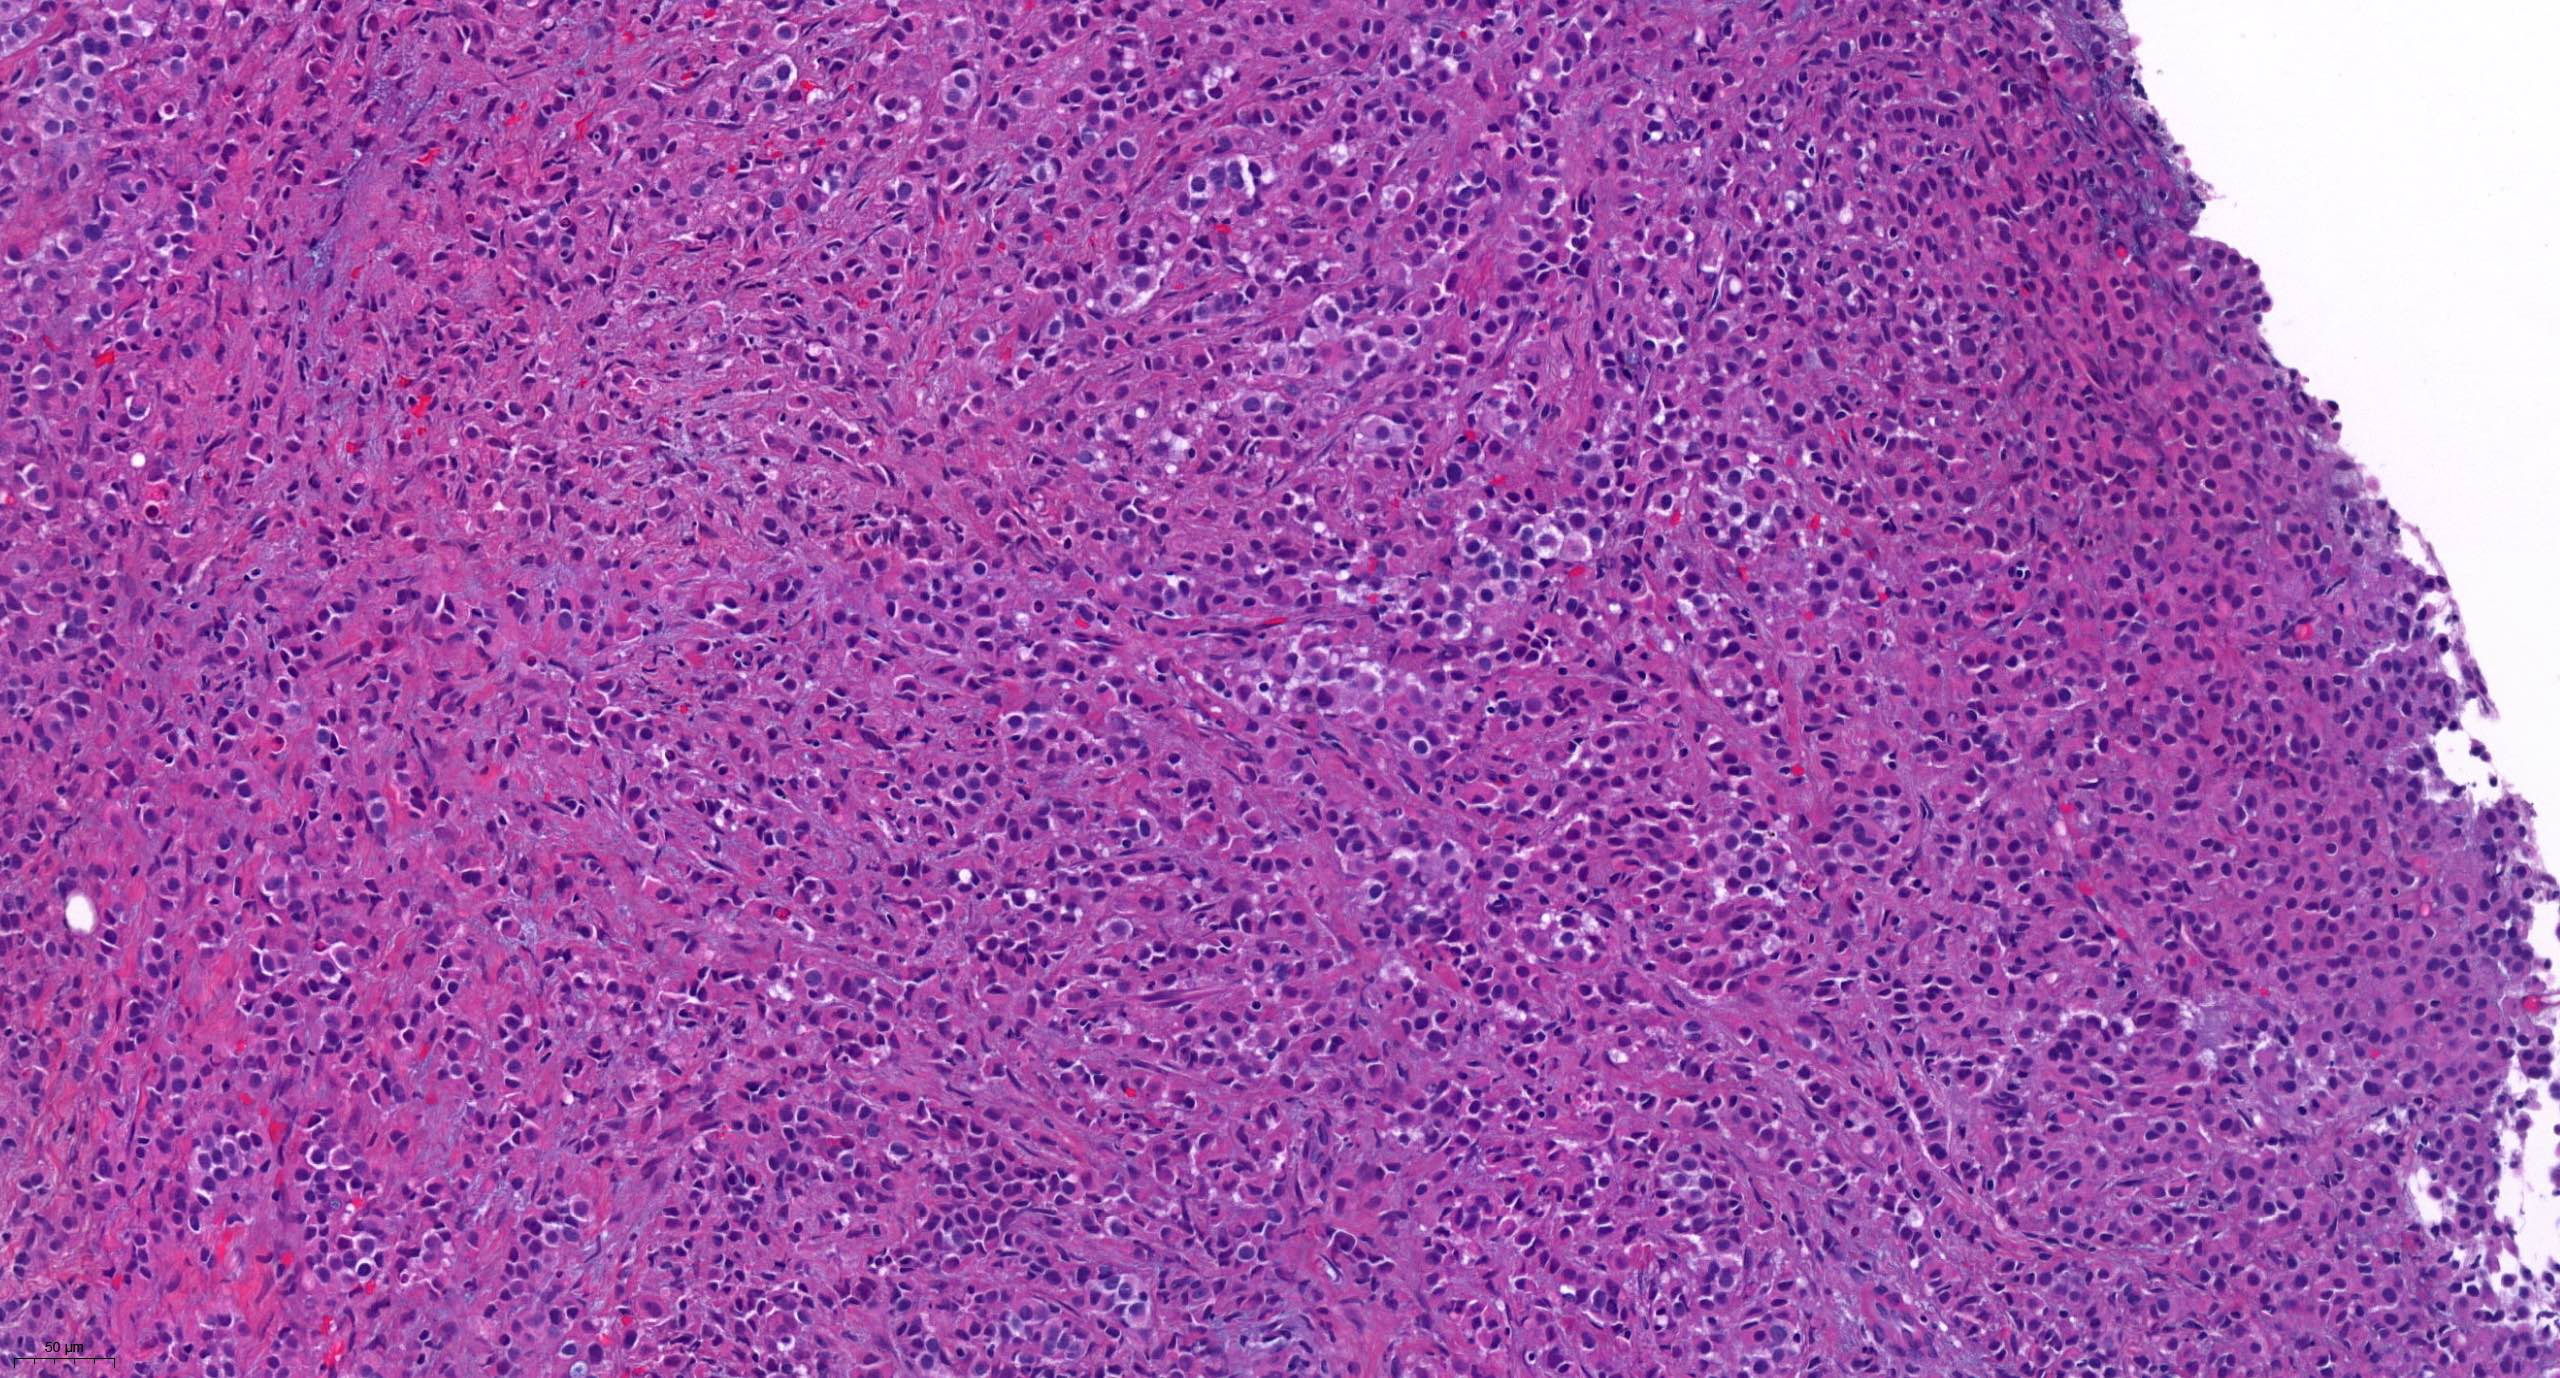
Gastric cancer
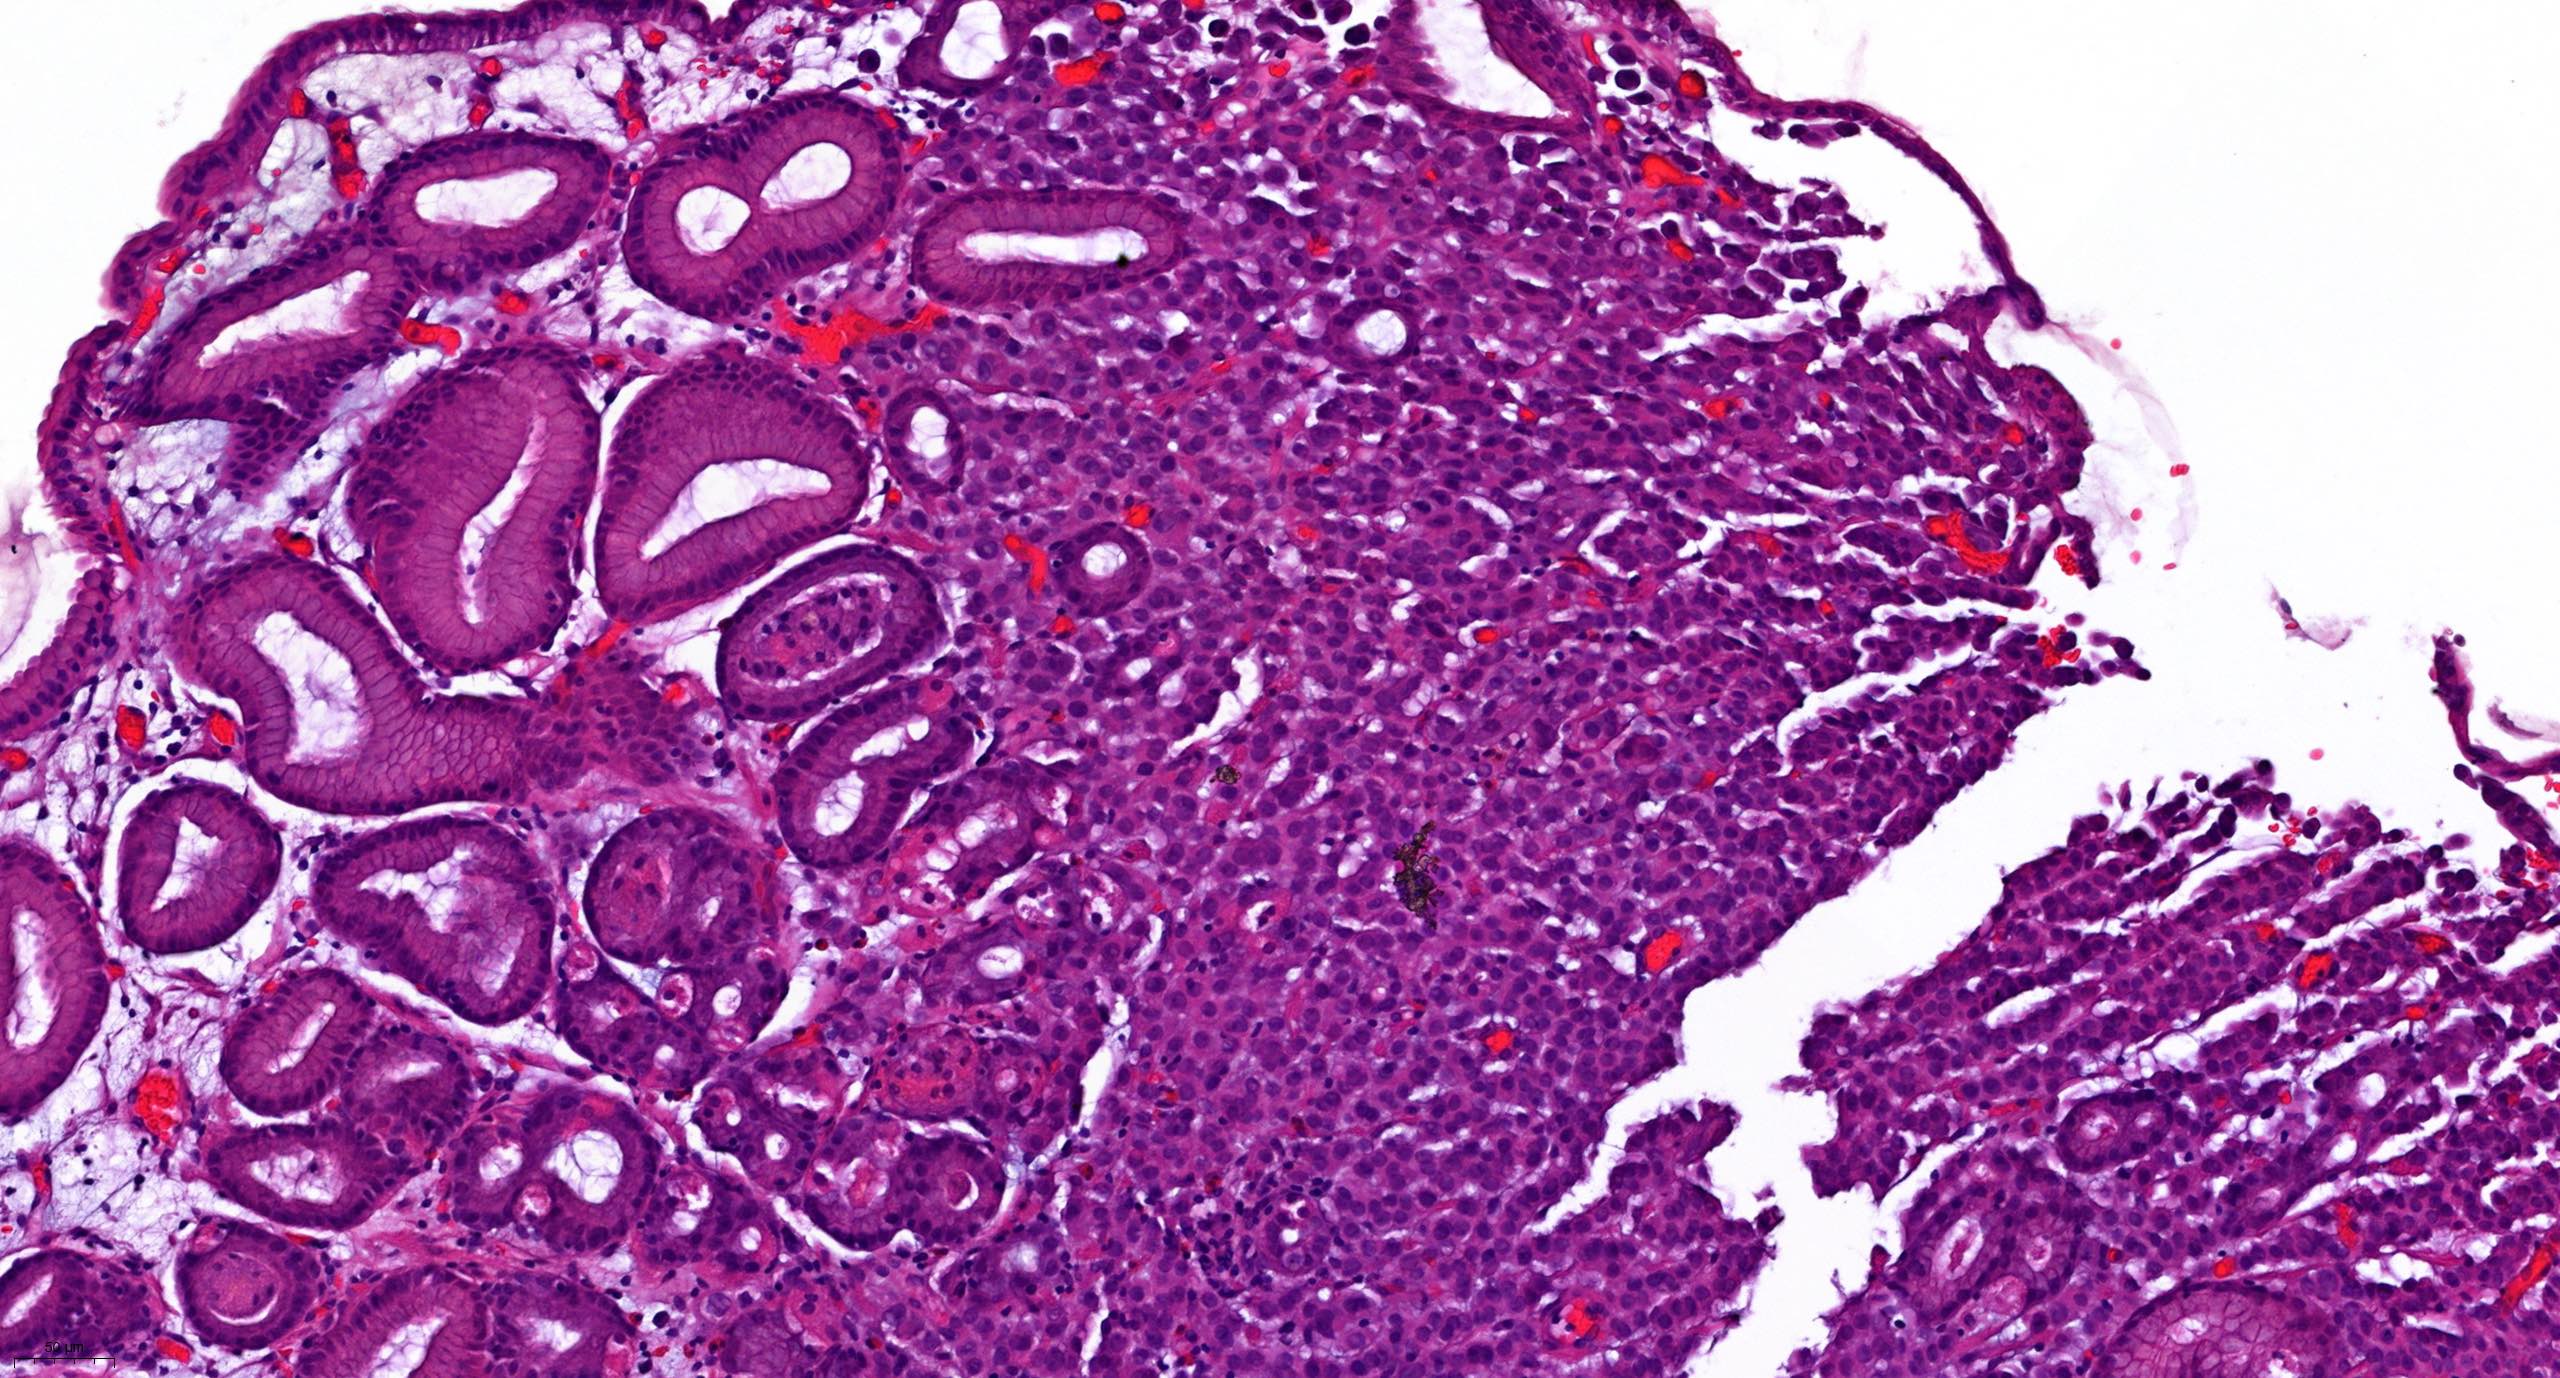
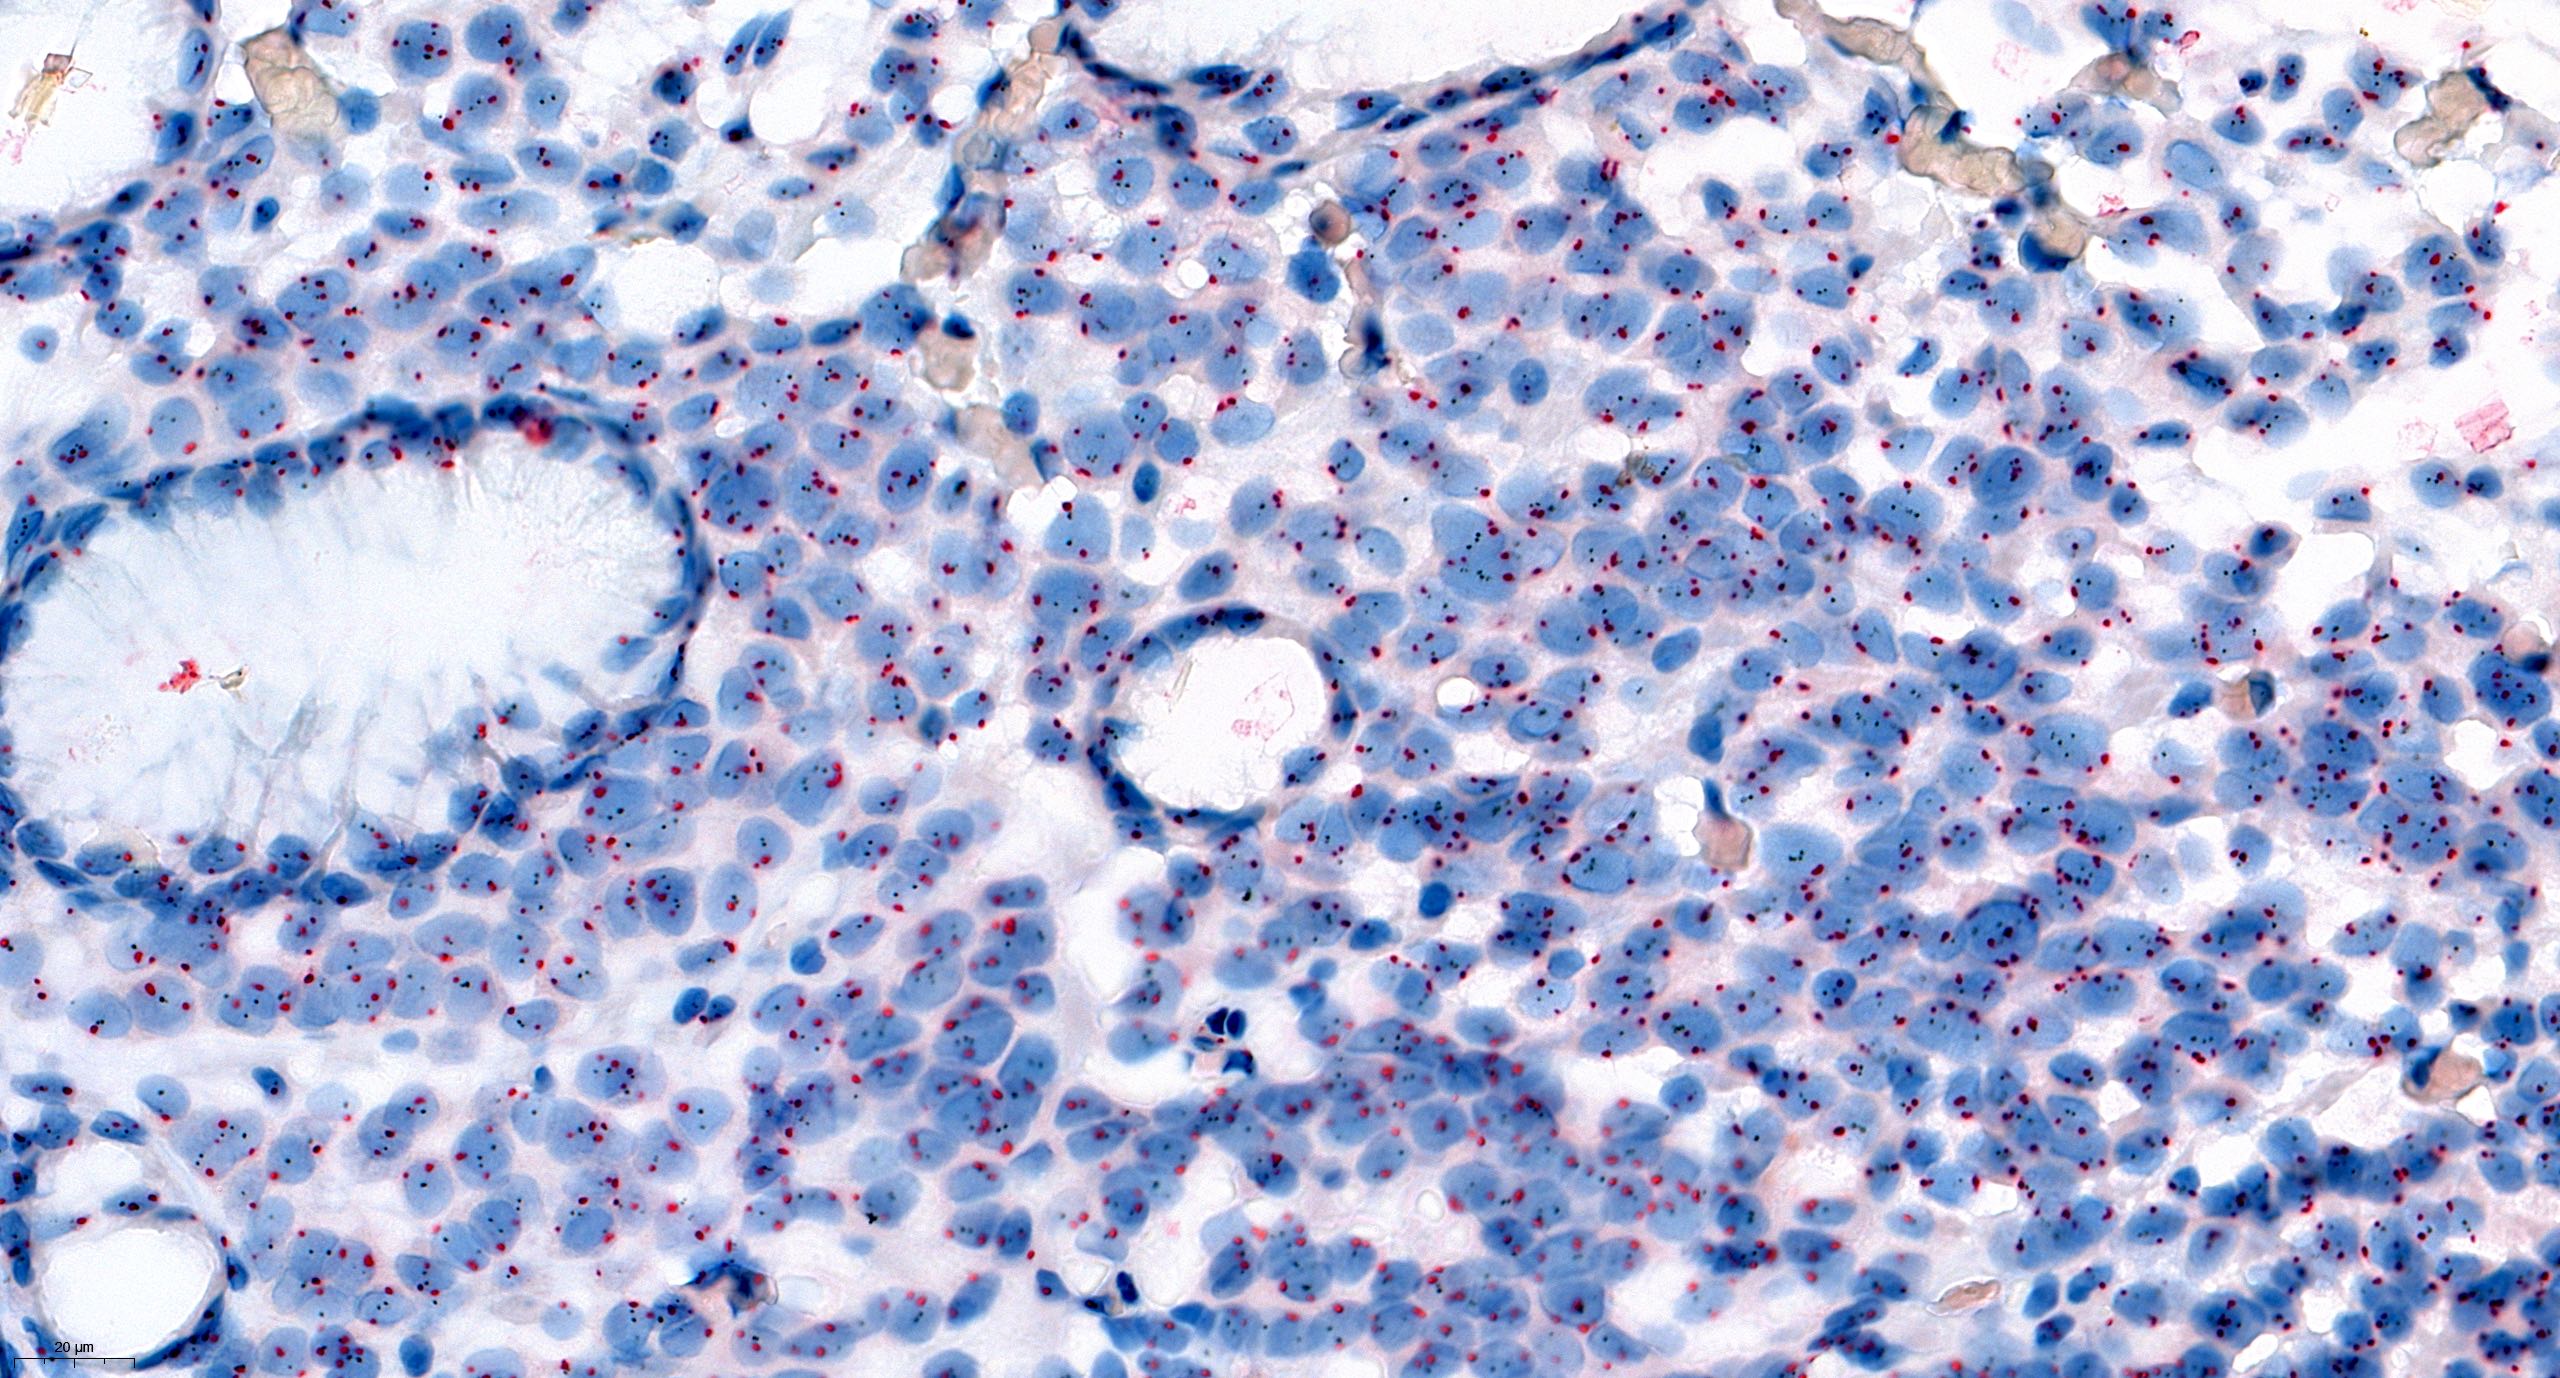
Gastric cancer
Gastric cancer
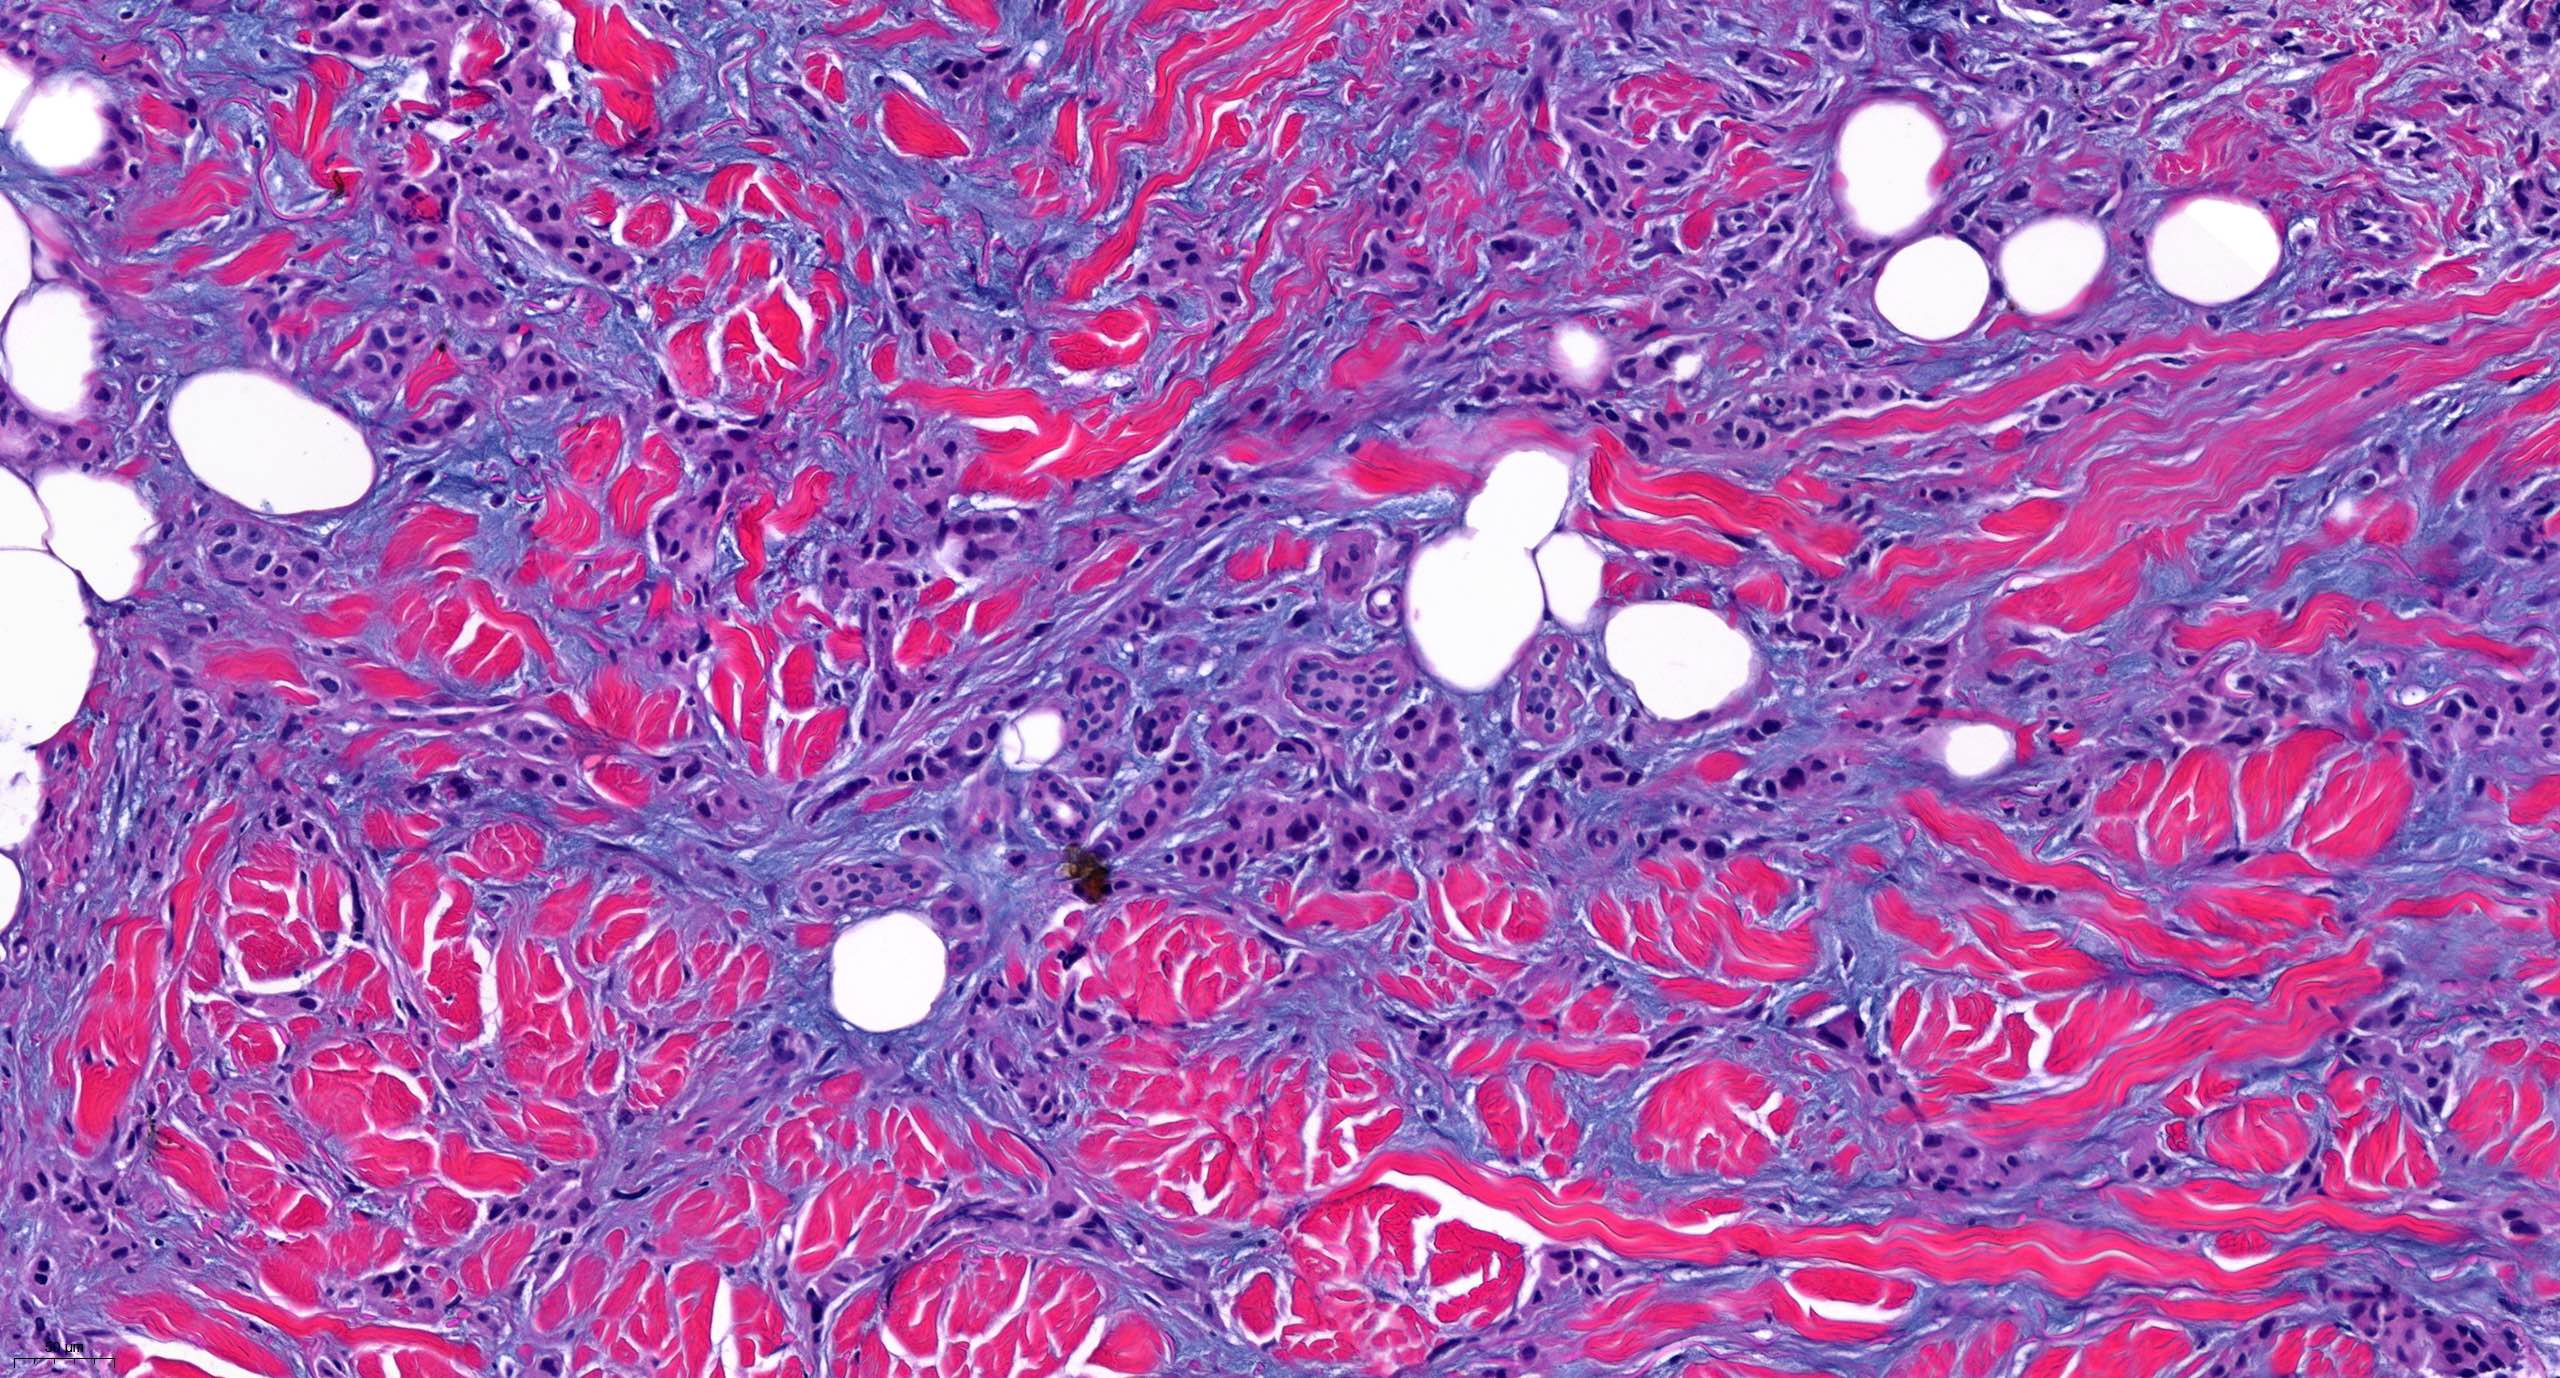
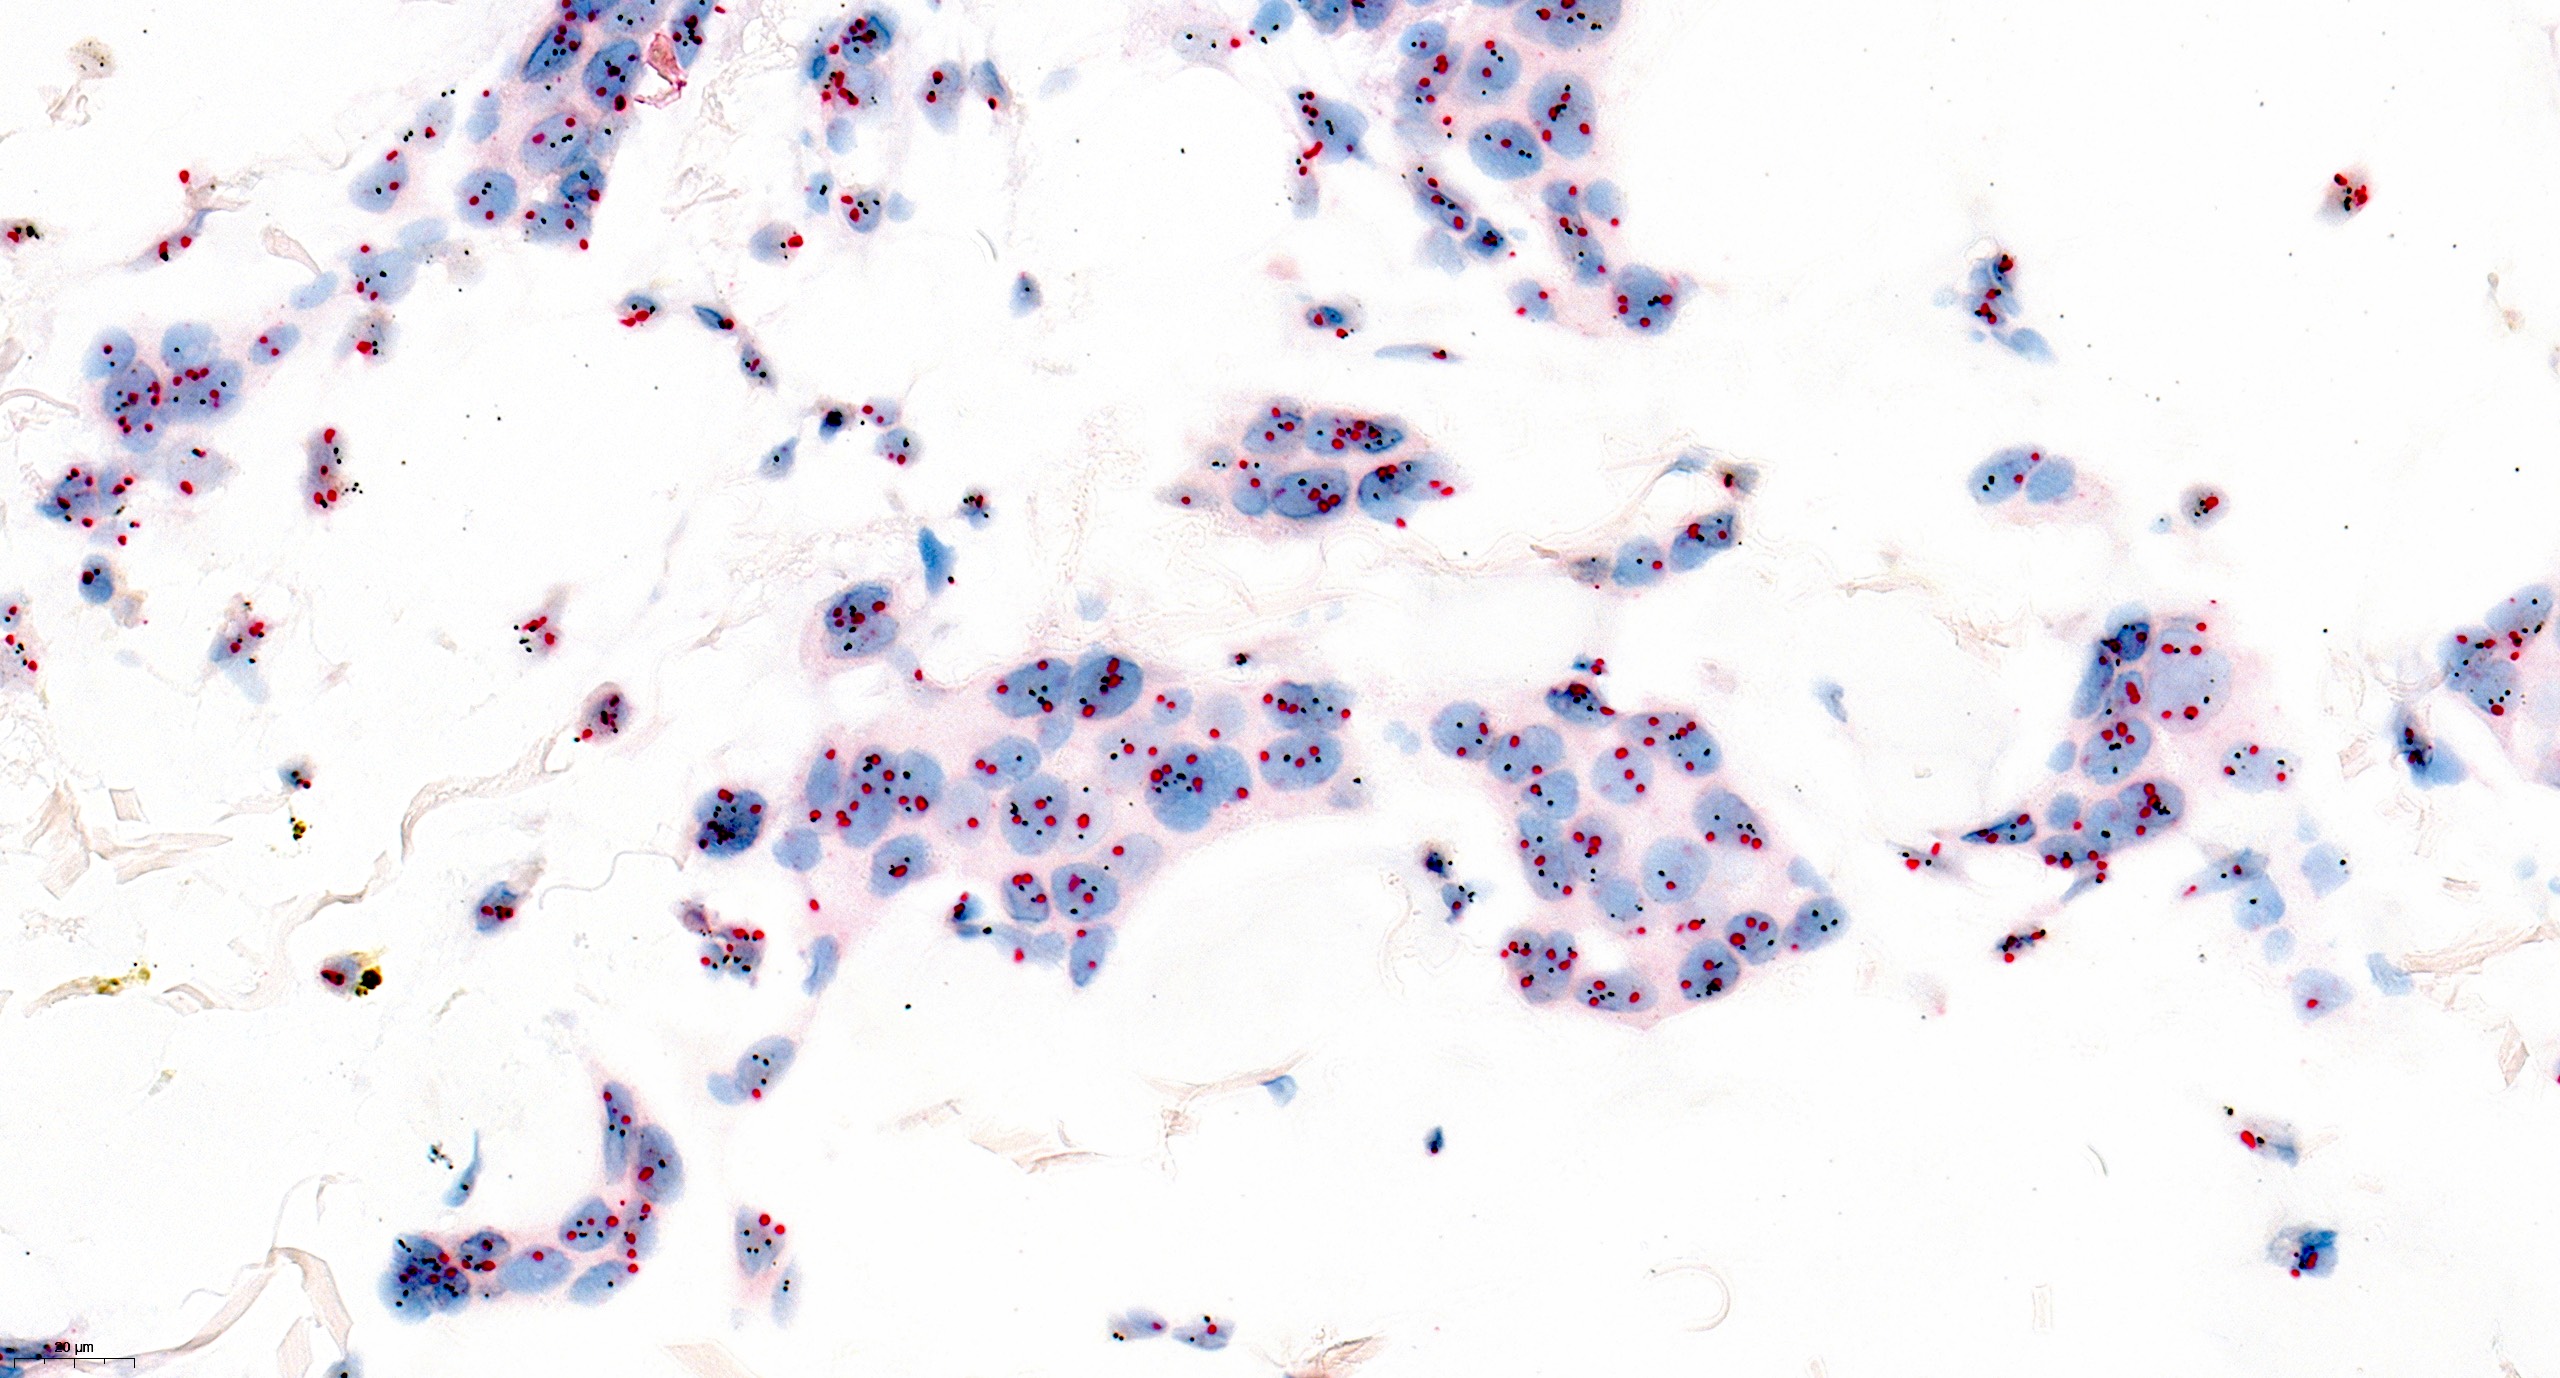
Breast cancer
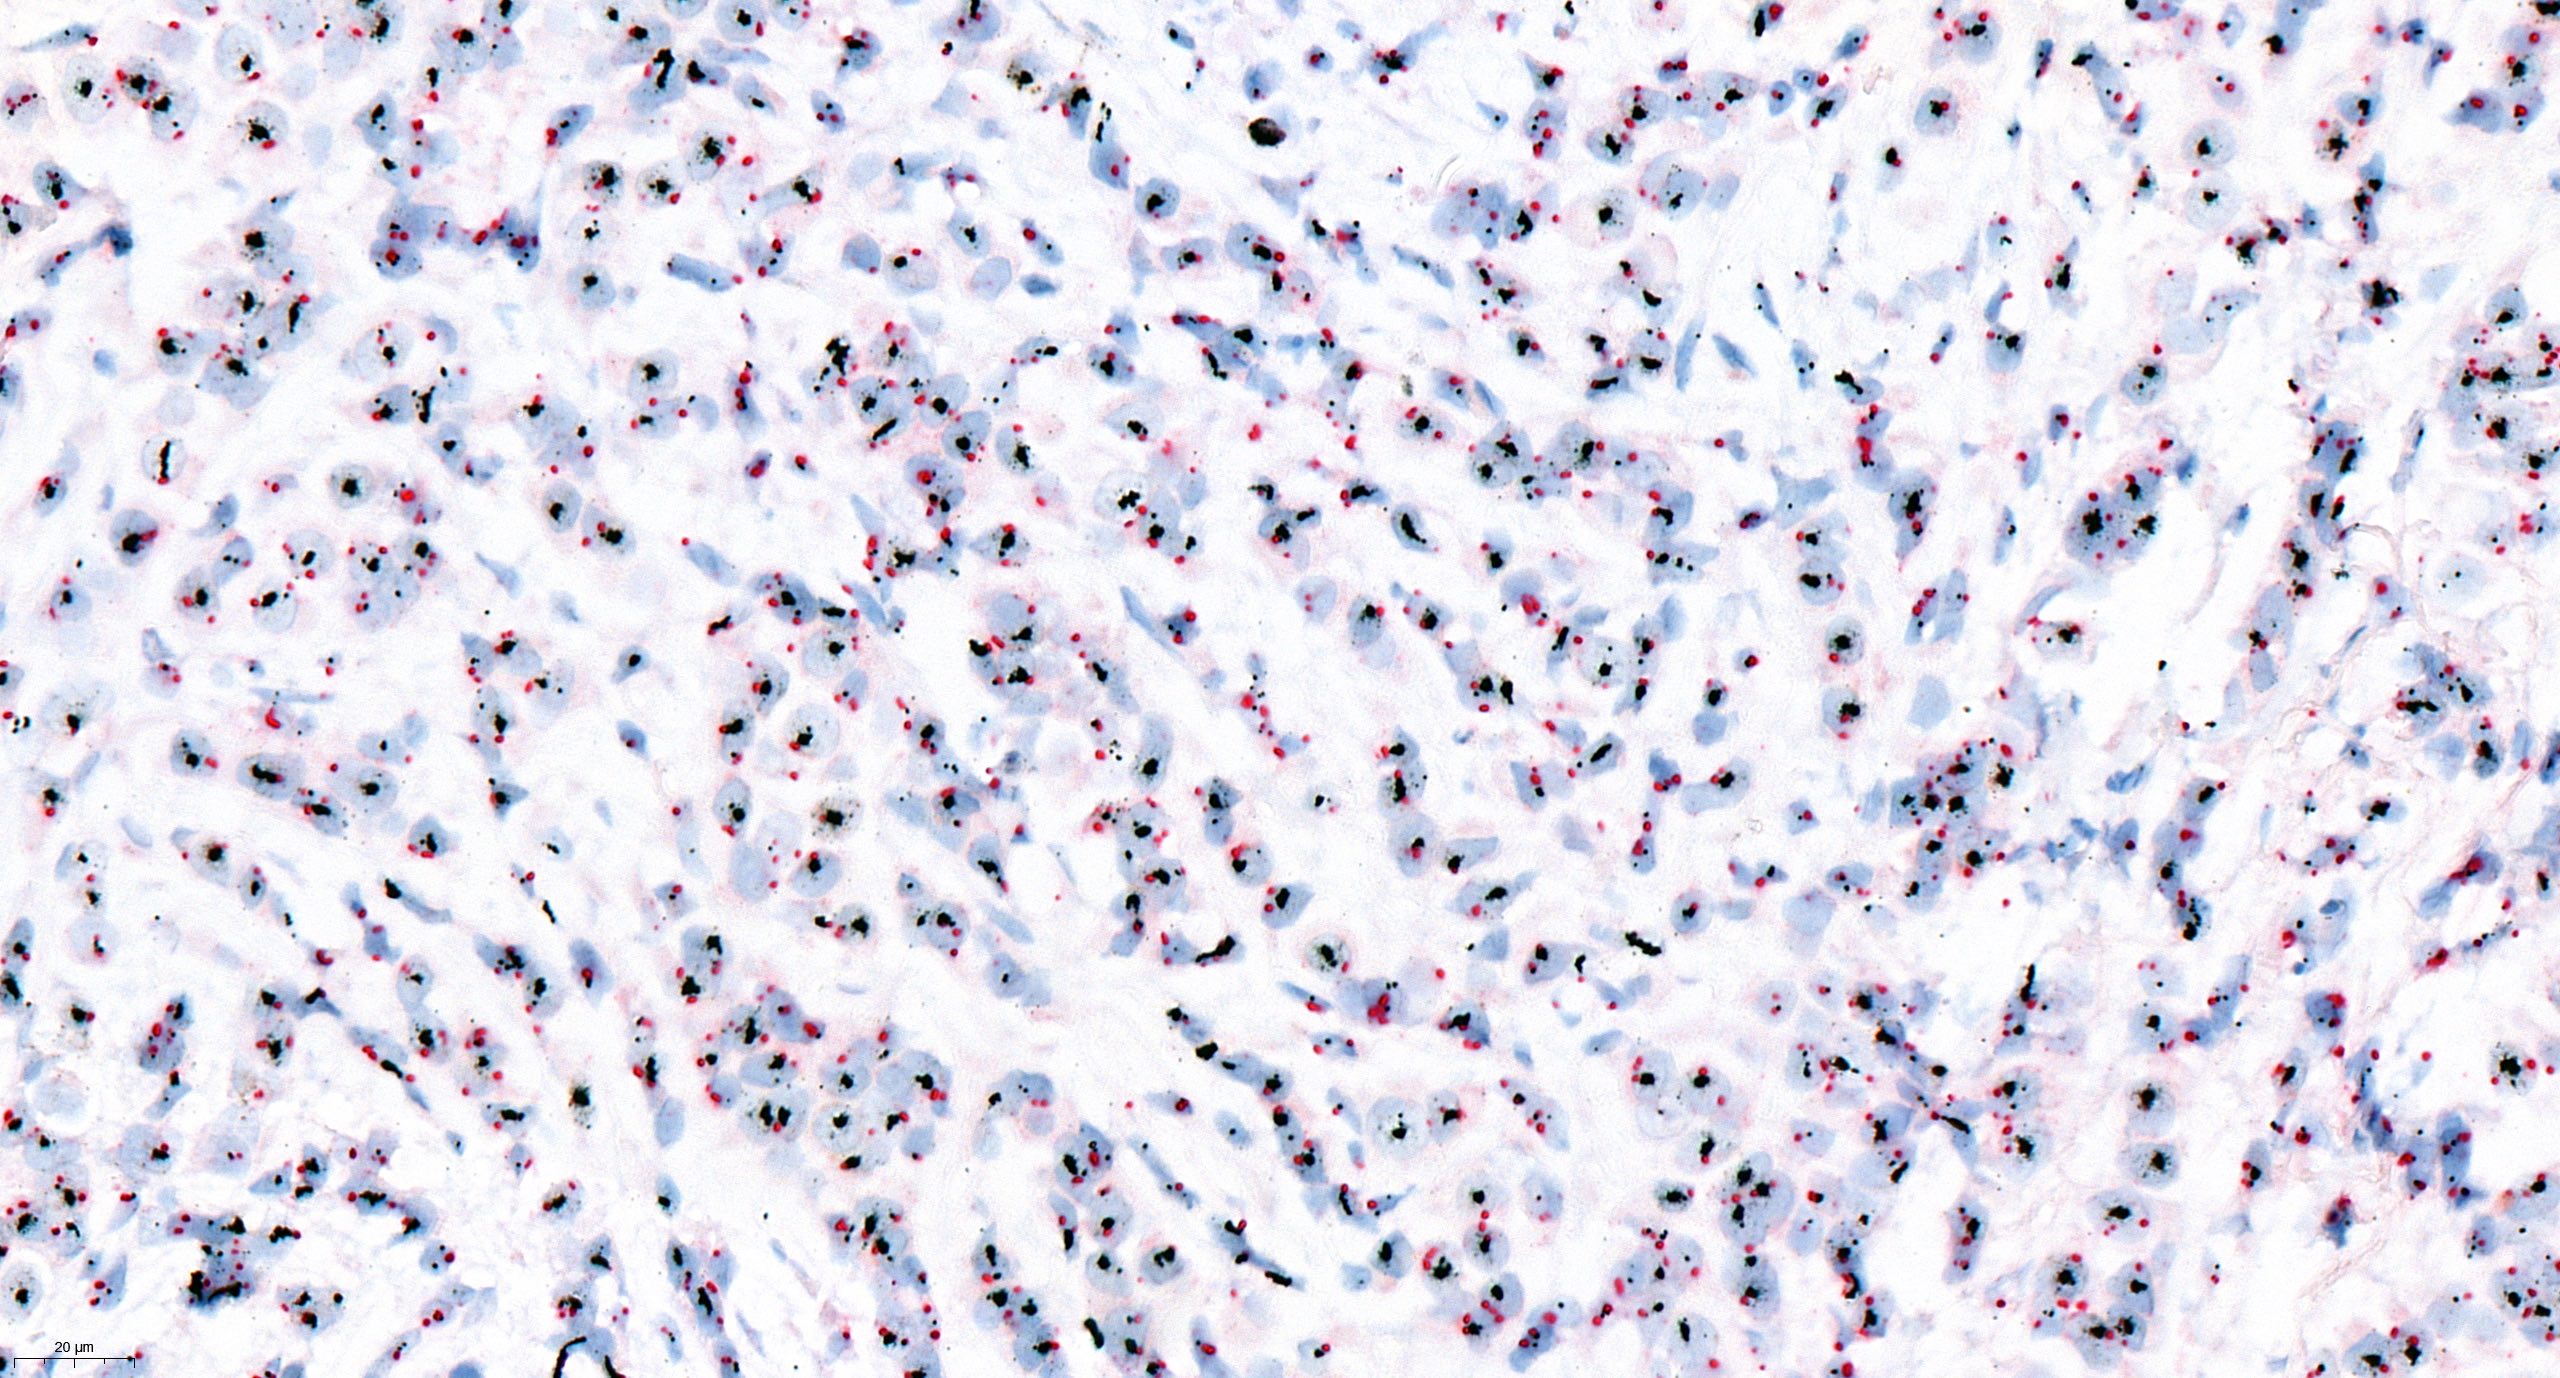
Breast cancer
1p / 19q codeletion
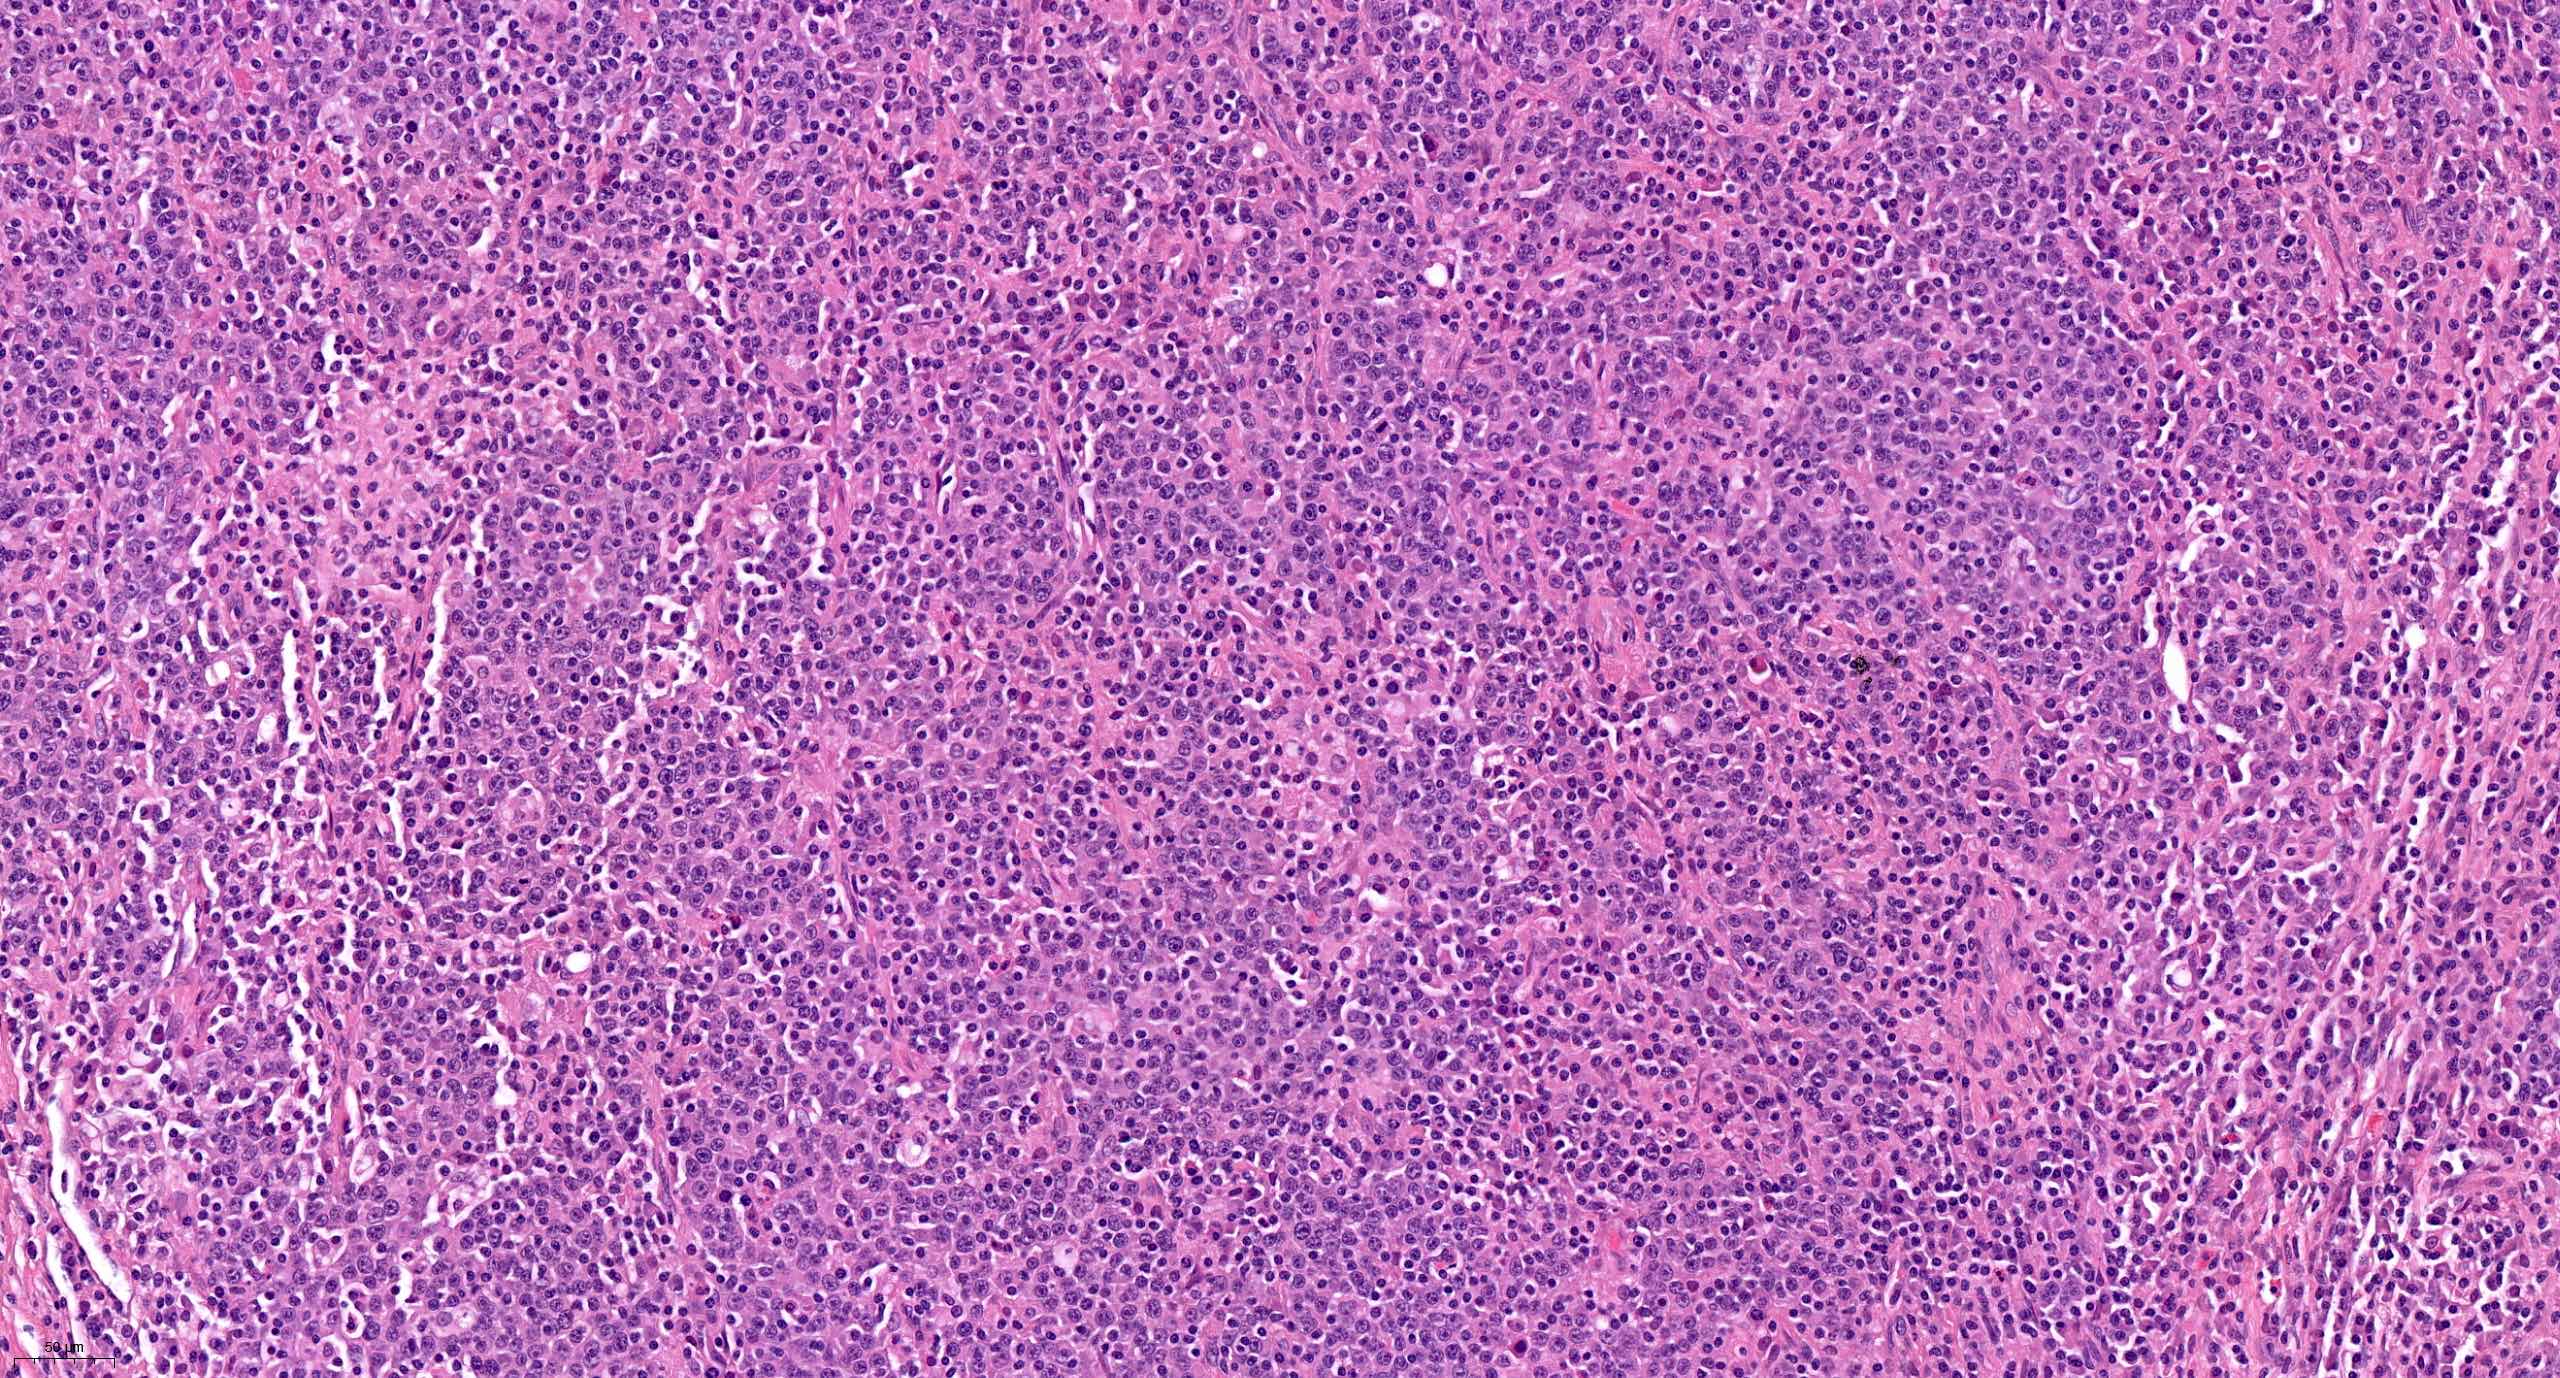
Gastric lymphoma
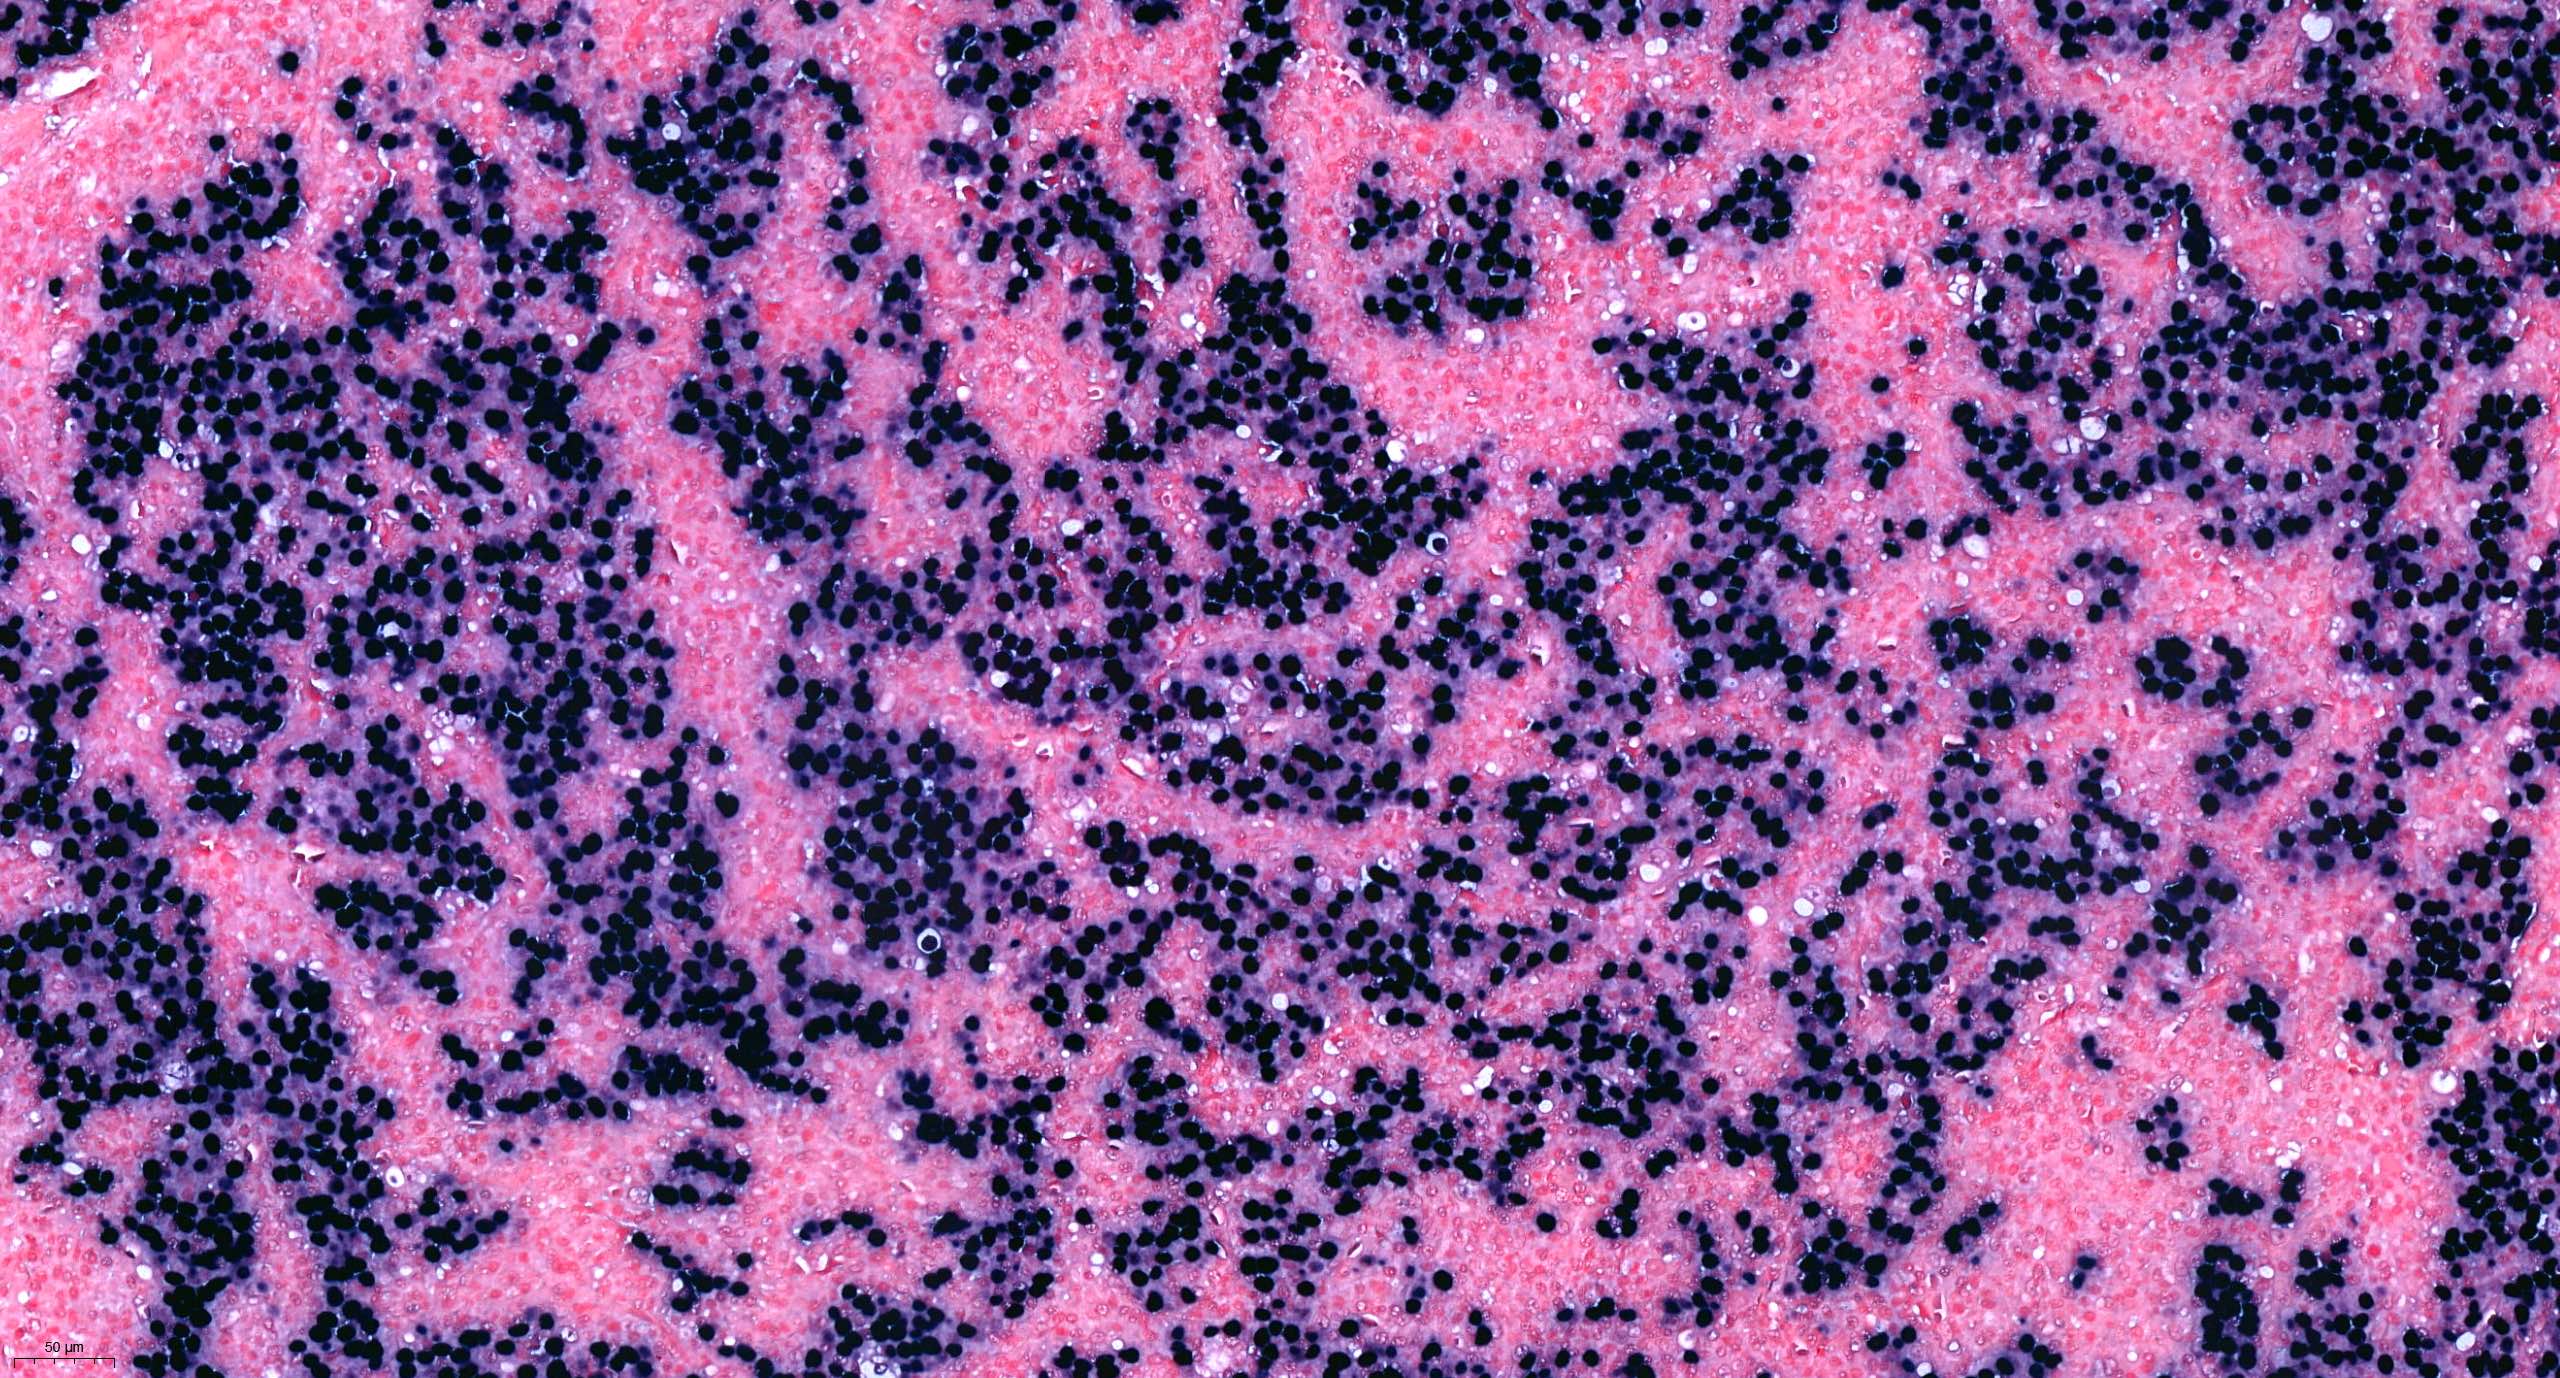
Lymph node
Immunoglobulin light chain
Images hosted on other servers:

Trisomy 21

UroVysion FISH test

Single molecule RNA FISH (smFISH)

In situ mutation detection of KRAS mutation


Albumin
Sample FISH report
- Example for HER2 FISH quantification in breast cancer:
- Number of neoplastic cells analyzed: at least 20 cells in 2 separate areas (at least 10/area)
- Number of HER2 signals: number of black dots
- Average HER2 copy number: number of black dots / number of analyzed cells
- Number of CEP17 signal: number of red dots
- Average CEP17 copy number: number of red dots / number of analyzed cells
- HER2/CEP17 ratio: number of black dots / number of red dots
- Genomic heterogeneity: absence / presence (percentage of the total tumor population with amplification)
- Probe: specify vender's probe
- Guidelines: ASCO / CAP 2023
- Type of fixative: formol / other
- Time to fixation (cold ischemic time): less than 1 hour
- Duration of tissue fixation: between 6 and 72 hours
- Commentary on the preanalytic conditions: the preanalytic conditions are (or are not) according to the recommendations of the ASCO / CAP 2023 guidelines for HER2 in breast cancer.
Board review style question #1
What is the pattern of a break apart rearrangement?
- 1 pair of different color signals together and 2 separate color signals
- 2 pairs of different color signals together
- 3 different color signals separate
- 4 different color signals separate
Board review style answer #1
A. 1 pair of different color signals together and 2 separate color signals.
There are 4 signals with 2 different colors. 2 separate color signals (abnormal separate signal) and 2 joint color signals (normal fused signal).
Answer B is incorrect because 2 pairs of different color signals together would represent the normal 2 fused signals.
Answer C is incorrect because 3 pair of different color signals together would represent 3 fused signals.
Answer D is incorrect because 4 different color signals separate would represent 2 pairs of abnormal separate signals.
Comment Here
Reference: FISH overview
Comment Here
Reference: FISH overview
Board review style question #2
What is the pattern of a fusion rearrangement?
- 1 pair of different color signals together and 2 separate color signals
- 2 pairs of different color signals together
- 3 pairs of different color signals together
- 4 different color signals separate
Board review style answer #2
A. 1 pair of different color signals together and 2 separate color signals.
There are 4 signals with 2 different colors. 2 separate color signals (normal separate signal) and 2 joint color signals (abnormal fused signal).
Answer B is incorrect because 2 pairs of different color signals together would represent 2 fused signals.
Answer C is incorrect because 3 pairs of different color signals together would represent 3 fused signals.
Answer D is incorrect because 4 different color signals separate would represent 2 pairs of normal separate signals.
Comment Here
Reference: FISH overview
Comment Here
Reference: FISH overview