Table of Contents
Definition / general | Essential features | Terminology | Software | Data repositories | Machine learning algorithms | Steps in building a machine learning model | Making your first model | Applications | Additional references | Board review style question #1 | Board review style answer #1 | Board review style question #2 | Board review style answer #2Cite this page: Cheng J. Machine learning fundamentals. PathologyOutlines.com website. https://www.pathologyoutlines.com/topic/informaticsmachinelearn.html. Accessed March 31st, 2025.
Definition / general
- Science of using computer algorithms to learn from patterns present in data and making predictions based on the learned patterns
Essential features
- Machine learning algorithm is used to create a model from a dataset from which predictions are made
- Machine learning model can be built without any knowledge of computer programming; for beginners, Orange software is a good starting point (GitHub: Orange - Interactive Data Analysis [Accessed 3 April 2024])
- Applications in pathology / laboratory medicine include molecular subtyping of cancer, image recognition / segmentation and identification of lesions in digital slides, digital slide stain normalization, information extraction from pathology reports
- Publicly available datasets applicable to machine learning can be found on the internet
Terminology
- AutoML (automated machine learning): these are tools / software libraries that build, choose and optimize machine learning models with minimal user input; in some cases, all you have to do is provide the dataset and set the target feature and it will start building machine learning models for you
- Deep learning: refers to neural networks with many layers; transformers and convolutional neural networks fall under that category due to the large number of layers (e.g., convolution or pooling layers)
- Other types of neural networks with multiple layers (such as artificial neural networks with several hidden layers) also fall under this classification
- Overfitting: the machine learning model memorizes the training data and corresponding outcome it was given and performs poorly on data it has never seen before
- Supervised machine learning: discovers relationships between feature variables and the target feature (label); the label has to be provided before the machine learning model can be trained to build a predictive model
- Target / outcome variable (label): value predicted based on the values of other variables in a dataset; it is analogous to the dependent variable in statistics
- Features that contribute towards making the prediction are equivalent to the independent variables in statistics
- Feature and variable are terms that are used interchangeably
- Unsupervised machine learning: unlike supervised machine learning, the data label is not needed to find patterns in a dataset (e.g., similar sets of data points forming unique clusters in a t-SNE plot or groups formed through k-means clustering)
Software
- Orange
- Knime
- Python + scikit-learn
- R
- AutoKeras - autoML library based on Keras
- Weka
- Teachable Machine
- TensorFlow
- PyTorch
- fast.ai
Data repositories
Machine learning algorithms
- Linear regression
- Given a set of points x and y, it finds the best fit line that goes through each pair of x and y points
- Used in laboratories to validate a new method for a particular test by comparing the results between the new method and the reference method (Clin Chem 1998;44:2340)
- Various software tools such as R and Python with scikit-learn simplify the process by performing all the necessary calculations
- Logistic regression (Ann Biol Clin (Paris) 1994;52:277)
- Statistical method for solving classification problems
- Equation based on the sigmoid function demonstrates the relationship between the target variable and 1 or more variables
- Predicts the probability of an outcome occurring
- Naïve Bayes
- Based on Bayes theorem, with the assumption that the variables involved contribute independently to the outcome variable; this assumption may be wrong, hence the description naïve
- Decision trees
- Optimal decision tree is constructed to fit the dataset
- Each node in the tree consists of a feature variable and each node splits into branches based on the value of the variable
- End of a branch is the value predicted for the target variable
- Outside of machine learning, decision trees are often used in diagnosis and treatment guidelines
- Random forest
- Versatile machine learning method
- Results from multiple decision trees are pooled together to arrive at the final prediction; each tree is generated using a random subset of the input dataset along with a random subset of the feature variables
- Gradient boosted trees
- Like random forests, it also involves multiple decision trees
- Applied to nonimage datasets, it has been able to achieve better predictive accuracy than random forests and other machine learning methods in most cases
- Support vector machines
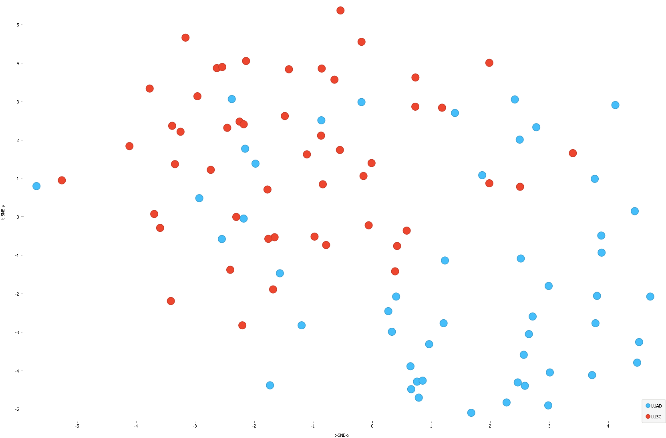
- Line, plane or hyperplane separates points in a dataset, separating them into classes
- K-means clustering
- Unsupervised machine learning algorithm that groups similar sets of data together
- Dimensional reduction methods
- E.g., PCA, t-SNE, autoencoders
- Reduces number of feature dimensions for easier interpretation or visualization
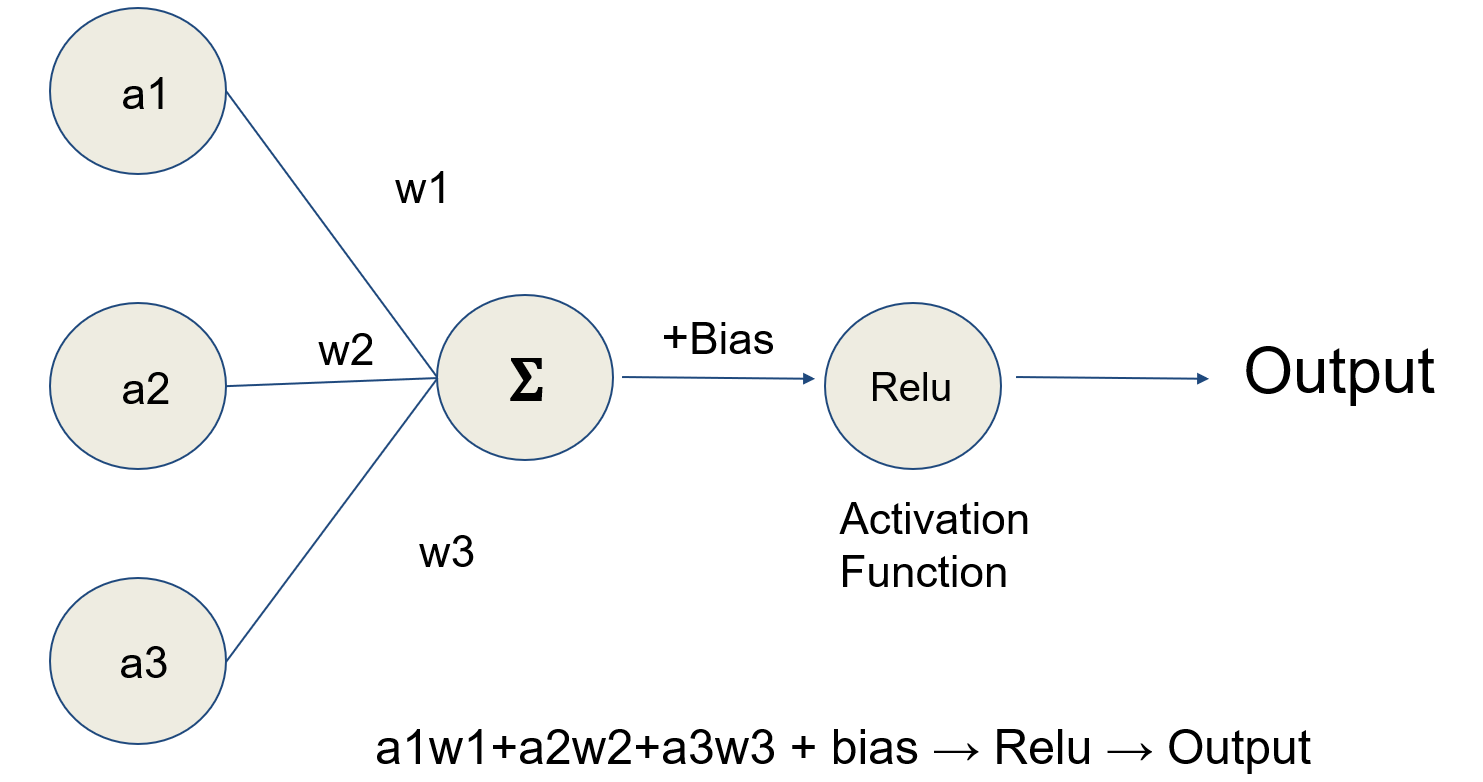
- Neural networks (Psychol Rev 1958;65:386)
- Inspired by interconnections between neurons in biological neural networks
- Convolutional neural network
- Type of neural network often used for image classification (e.g., cancer subtype or benign versus malignant) (Urol Clin North Am 2024;51:15)
- Also used for semantic segmentation, object detection with classification, generation of fake images and style transfer (generative adversarial network), natural language processing
- Generative adversarial network
- Involves 2 neural networks
- Generator: creates fake data
- Discriminator: distinguishes real from fake data
- Goal of training is for the generator to become better at creating images that look real to the discriminator
- Involves 2 neural networks
- Autoencoders
- Type of neural network that transforms an input into an intermediate representation, from which the original input is recreated
- Transformers
- Deep learning architecture based on the self attention mechanism (Korean J Radiol 2024;25:113)
- Used for computer vision (vision transformer) and natural language processing
- Includes large language models (e.g., GPT-4, Llama2, Mistral) that can provide human-like responses to questions / instructions (prompts)
- Natural language processing
- Text may be converted to a numerical matrix though word embeddings or bag of words representations; these embeddings or bag of words representations may be combined with other machine learning algorithms to make predictions from textual data (Stud Health Technol Inform 2017;235:256)
- Word and sentence embedding techniques
Steps in building a machine learning model
- Data collection and preparation
- Usually the most time consuming process in building models
- Data can come from a variety of sources including questionnaires, internet searches, databases and images
- CSV (comma separated values) file format, as well as other spreadsheet style formats are commonly used for training machine learning models; each feature is designated by a column and each row represents a record
- Choose a programming language or machine learning platform
- Python is currently the most popular programming language used in machine learning; the Python scikit-learn library includes many commonly used machine learning algorithms
- Orange and Knime are open source GUI (graphical user interface) based machine learning platforms; these are easy to use and require no programming experience
- Choose a machine learning algorithm
- Set the hyperparameters for the model
- Split the data into training, validation and holdout sets
- Validation set
- During the process of training, the model is tested on the validation set to assess its performance (e.g., accuracy or AUC ROC); hyperparameters of the model may be altered during training process to improve the performance of the model
- Training accuracy much higher than the validation accuracy is a sign of overfitting
- Also referred to as the development set
- During the process of training, the model is tested on the validation set to assess its performance (e.g., accuracy or AUC ROC); hyperparameters of the model may be altered during training process to improve the performance of the model
- Holdout dataset
- Used to assess the performance of the final model on unseen data after it has been fully trained; unlike the validation set, it is never exposed to the trained model and should give a better measure of performance
- For smaller datasets, the holdout set may be omitted and model accuracy can be assessed using cross validation methods
- Commonly used ratios for training, validation and holdout sets
- 70/15/15
- 60/20/20
- Very large datasets can have a larger proportion of the data in the training set (e.g., 80/10/10 or 90/5/5)
- Validation set
- Train and test the model
- Test the performance of the model on the validation set
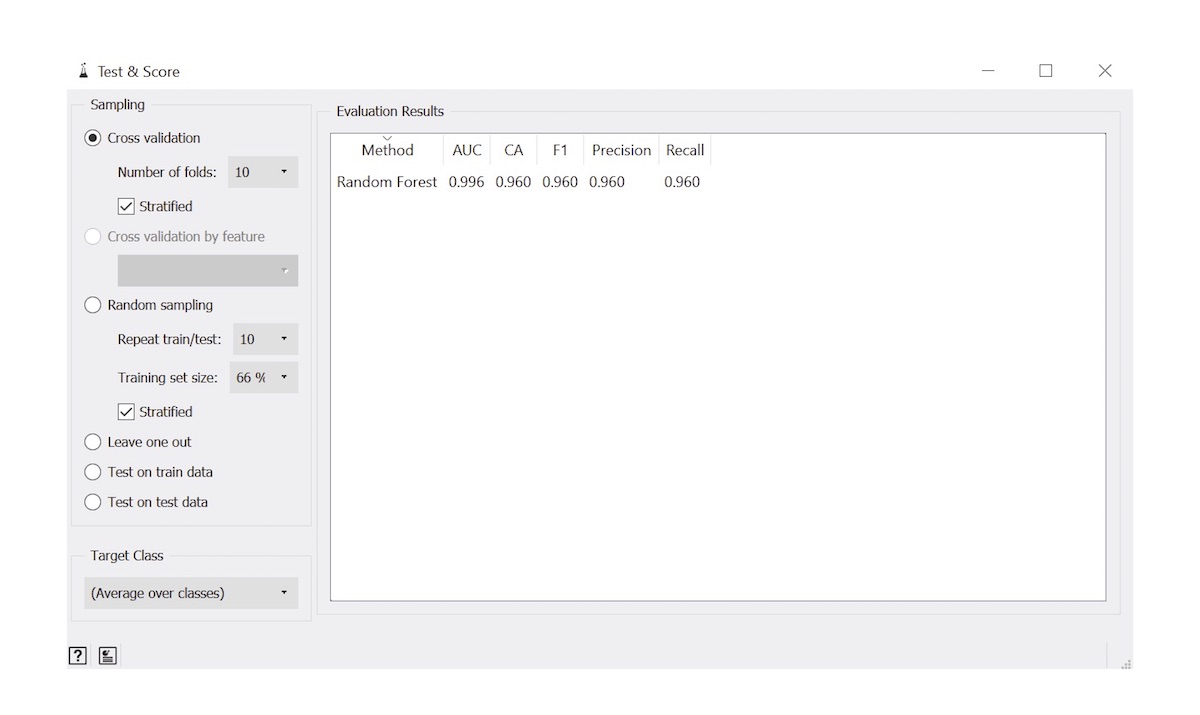
- Commonly used metrics
- Accuracy
- Log loss
- AUC (area under ROC curve)
- Precision
- Recall
- F1 score
- For smaller sample sizes
- K-fold cross validation: entire dataset is subdivided into K subsets; each subset acts as the validation / test set once and the rest of the data are used for training the model; model performance is assessed by averaging the results attained from each subset
- Leave-one-out cross validation: model is trained using the entire dataset except for one data point and the model is validated with the data point that was left out; process is repeated until every data point has been used as the test data point
- Random stratification: set percentage of the dataset is randomly assigned to the training set and the remaining become the test set
- Optimize the model
- Fine tune the model parameters
- Add new data to the dataset
- Change the features in the dataset
- Add additional features
- Image augmentation (for convolutional neural networks)
- Test the performance of the final model on the holdout set
- Gives a better measure of real world model performance
Making your first model
- Creating machine learning models with GUI based platforms like Orange is quick and easy
- Download and install Orange through the following link (GitHub: Orange - Interactive Data Analysis [Accessed 3 April 2024])
- Launch the program and a welcome screen will appear
- Select the New option
- In Orange, various tasks are done through widgets, which are represented by various icons on the left side of the user interface
- Click on the Datasets widget found on the left side of the screen and drag it into the canvas (the empty portion of the screen on the right side); double click on it and choose a dataset from the list that appears; click on the Send Data button
- Add the Test & Score widget to the canvas
- Add the Random Forest widget to the canvas
- Another machine learning algorithm instead of Random Forest can be chosen
- Connect the Test & Score widget to the Datasets widget by clicking on it and connecting the line that appears to the Datasets widget
- Connect the Random Forest widget to Test & Score
- Canvas should look something like
Double click on Test & Score and the performance of the newly built model will be displayed
Applications
- Applications of machine learning in medicine are vast and include
- Risk stratification (Infect Control Hosp Epidemiol 2018;39:425)
- Predicting drug response (Clin Gastroenterol Hepatol 2010;8:143)
- Cancer metastases detection in lymph nodes (JAMA 2017;318:2199)
- Molecular subtyping of cancer (Brief Bioinform 2019;20:572)
- Prediction of susceptibility to Vibrio cholerae infection (J Infect Dis 2018;218:645)
- Blood pressure estimation using electrocardiogram (ECG) signals (Sensors (Basel) 2018;18:1160)
- Histopathology image stain normalization (Conf Proc IEEE Eng Med Biol Soc 2014;2014:194)
- Mitosis counting (Med Image Anal 2024;94:103155)
- Prostate cancer diagnosis (Adv Anat Pathol 2024;31:136)
- Breast cancer detection (NPJ Breast Cancer 2022;8:129)
- Whole slide image quality control (J Pathol Inform 2023;14:100306)
- Ki67 quantification (Histopathology 2023;83:981)
- Deidentification of pathology reports (J Med Internet Res 2023;25:e48145)
- Information extraction from pathology reports (J Am Med Inform Assoc 2020;27:89)
Additional references
- J Mach Learn Res 2013;14:2349, Wikipedia: Machine Learning [Accessed 3 April 2024], Wikipedia: Cross-Validation (Statistics) [Accessed 3 April 2024], Chollet: Deep Learning with Python, 1st Edition, 2017, Lane: Natural Language Processing in Action - Understanding, Analyzing, and Generating Text with Python, 1st Edition, 2019
Board review style question #1
Board review style answer #1
C. Random forest. In random forest, results from multiple decision trees are pooled together to arrive at the final prediction; each tree is generated using a random subset of the input dataset along with a random subset of the feature variables. Answer A is incorrect because linear regression estimates the relationship between 2 variables using the line of best fit. Answer B is incorrect because neural networks do not use decision trees. Answer D is incorrect because support vector machines separate points in a dataset using lines, planes and hyperplanes.
Comment Here
Reference: Machine learning fundamentals
Comment Here
Reference: Machine learning fundamentals
Board review style question #2
Which of the following looks for the best fitting straight line that goes through a set of X and Y points?
- Convolutional neural networks
- Linear regression
- Neural networks
- Random forest
Board review style answer #2
B. Linear regression. In linear regression, an entire set of X and Y points is used to arrive at the linear equation y = bx + a, where b is the slope and a is a constant. Linear regression can be used for validation of laboratory test results. Answer A is incorrect because a convolutional neural network is a type of neural network often used for image classification. Answer C is incorrect because neural networks optimize model performance by adjusting weights and biases. Answer D is incorrect because random forest models combine results from multiple trees.
Comment Here
Reference: Machine learning fundamentals
Comment Here
Reference: Machine learning fundamentals


