
Informatics, digital & computational pathology
Image analysis
Image analysis fundamentals
Author: Jerome Cheng, M.D.
Editorial Board Member: Lewis A. Hassell, M.D.
Editor-in-Chief: Debra L. Zynger, M.D.

Last author update: 16 May 2022
Last staff update: 16 May 2022
Copyright: 2019-2024, PathologyOutlines.com, Inc.
PubMed Search: Image analysis

Table of Contents
Definition / general | Background | Essential features | Terminology | Image analysis / processing techniques | Applications | Tools | Board review style question #1 | Board review style answer #1 | Board review style question #2 | Board review style answer #2Cite this page: Cheng J. Image analysis fundamentals. PathologyOutlines.com website. https://www.pathologyoutlines.com/topic/informaticsimganalysisintro.html. Accessed April 19th, 2024.
Definition / general
- Extraction of useful information from virtual slides and other digital images, commonly acquired through a whole slide scanner or camera
- Tools, such as ImageJ, may be used to characterize the nuclei in a histological image of a soft tissue tumor; further analysis of the differences in nuclear shape, color and texture can aid in the classification of the type of lesion present in a specimen (Zentralbl Pathol 1994;140:351)
Background
- Digital images are composed of pixels arranged in a grid-like manner, with each pixel assigned x and y coordinates
- Below is an image of a neutrophil magnified to emphasize each pixel; these pixels appear as square blocks of different colors
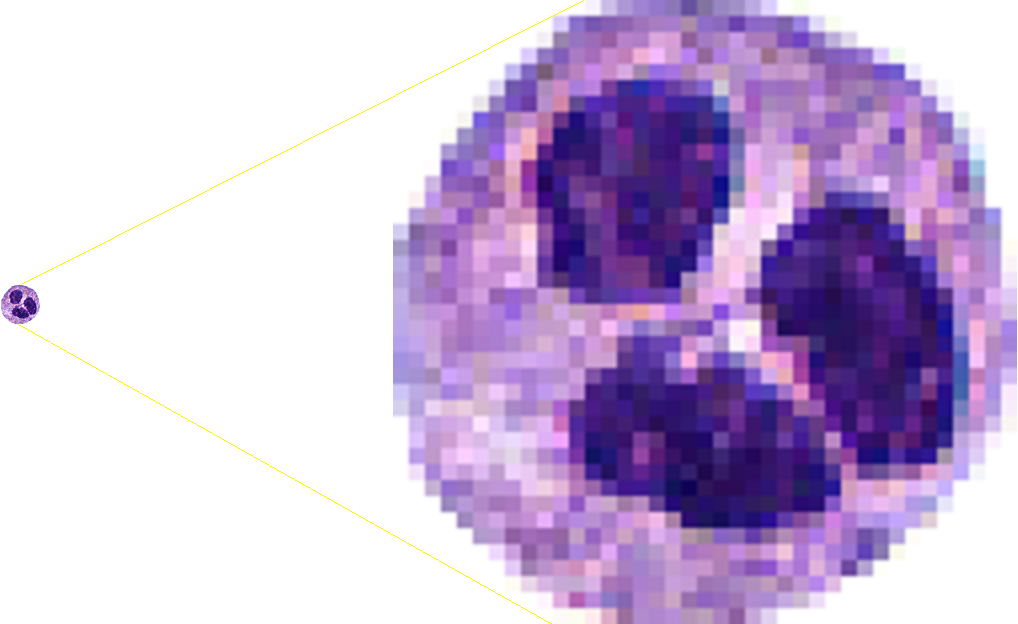
- Typical high definition computer monitors have 1920 columns and 1080 rows of pixels, making up a total of 1920 x 1080 = 2,073,600 pixels; 4K computer displays have 3840 x 2160 = 8,294,400 pixels
- Colors in a digital image are commonly based on the RGB color model, with an image depth of 24 bits (8 bits for each color: red, green and blue); in this color representation, the pixels that make up an image are composed of varying intensities of the 3 colors; each color has an intensity value ranging from 0 to 255 and the combination of these 3 color intensities will produce a specific color, giving a possibility of 16,777,216 colors (256 x 256 x 256 = 16,777,216)
- In image processing and analysis, the data are analyzed by performing various mathematical operations on numeric data derived from an image
- Image analysis techniques generally fall in the realm of traditional (hand crafted) and deep learning approaches
- Traditional methods require more manual work to identify features, while deep learning methods (e.g., convolutional neural networks) discover image features automatically during the training process
- For more details, see Computational pathology fundamentals & applications
Essential features
- Image processing steps to modify and enhance image attributes are frequently involved to facilitate further processing or analysis of images
- Combination of different image processing techniques are usually needed to perform a particular type of analysis
- Image features, acquired through image processing techniques, can be combined with machine learning and statistical methods to categorize different types of cells, nuclei or cancer; dimensional reduction techniques, like principal component analysis (PCA) and t-distributed stochastic neighbor embedding (t-SNE), may be used to visualize the differences in classes through a 2 dimensional or 3 dimensional graph (e.g., type of cell) based on feature characteristics
Terminology
- Image processing: application of a set of mathematical operations or computer algorithms to a digital image to alter the image or derive useful information from it
- Structuring element: defines the region / shape surrounding a pixel for morphologic operation
- 3 x 3 square structuring element is often used by default, if no structuring element is specified
- Below is a diamond shaped structuring element with a radius of 3; when used with a morphologic operation, every white region in the structuring element contributes to calculations that will determine the final value of the pixel that overlaps with the center of the structuring element (3,3)
- Image of the structuring element was created using Octave
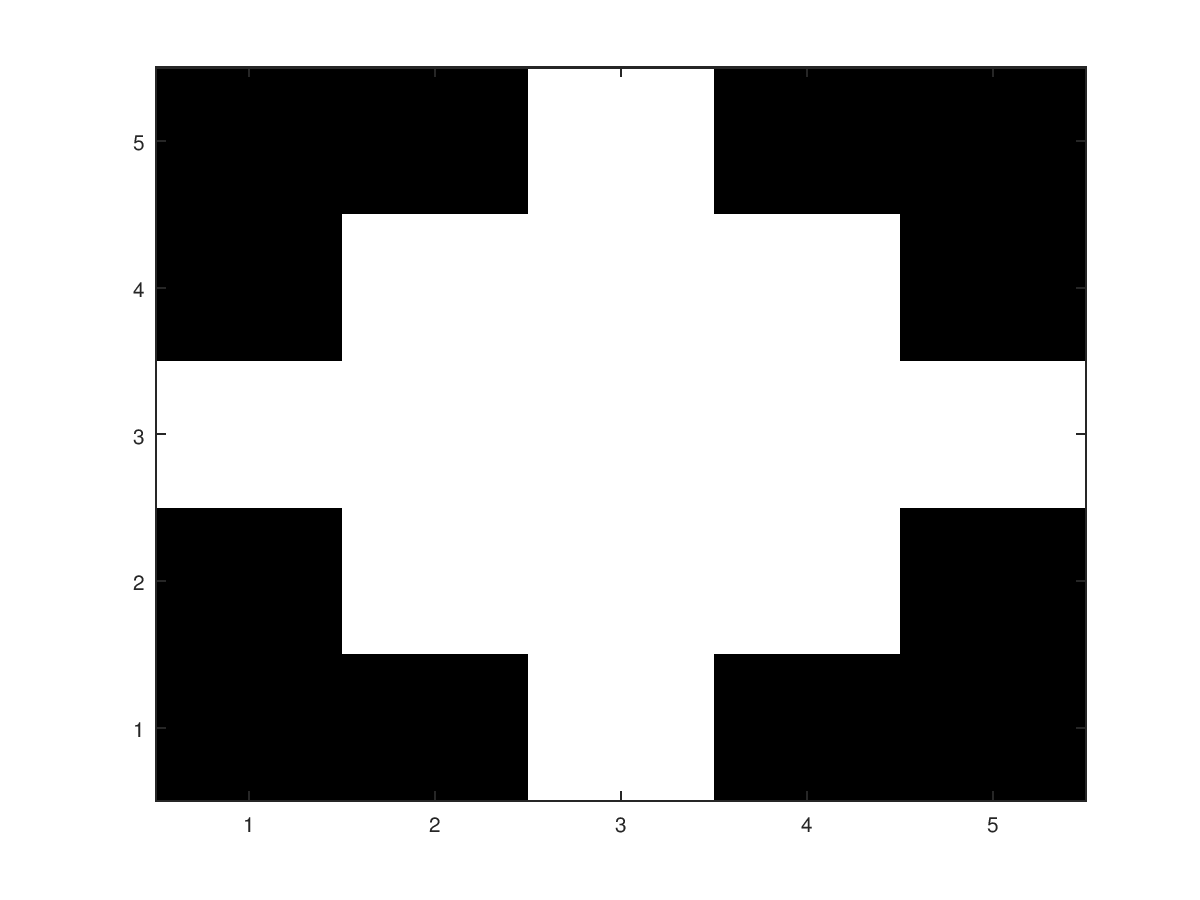
Image analysis / processing techniques
- Examples and methods shown below can be replicated using readily available tools such as ImageJ, GIMP and OpenCV and other open source software
- Grayscale operation: averages the value from each color channel to produce a black and white image
- Example of RGB image converted to grayscale
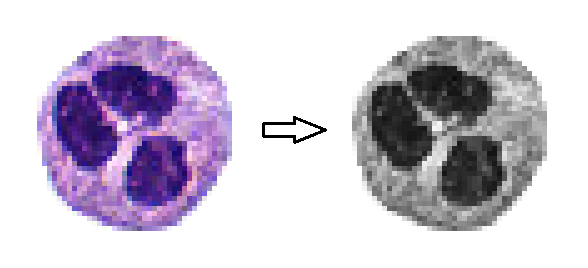
- To perform a grayscale operation using GIMP: load the image; then under the image menu, select "mode" and choose the grayscale option
- Example of RGB image converted to grayscale
- Histogram: shows the frequency of each color in a graph, with each color intensity arranged left to right from lowest to highest intensity
- ImageJ: analyze menu → histogram
- Histogram of the neutrophil above (red channel); analysis was performed using ImageJ

- Geometric transformations: rotation, scaling, cropping and shifting (these are often used in image augmentation for deep learning studies)
- Morphologic operations: erosion, dilation, opening, closing
- Dilation: enlarges objects
- Can be used to fill holes or for edge detection
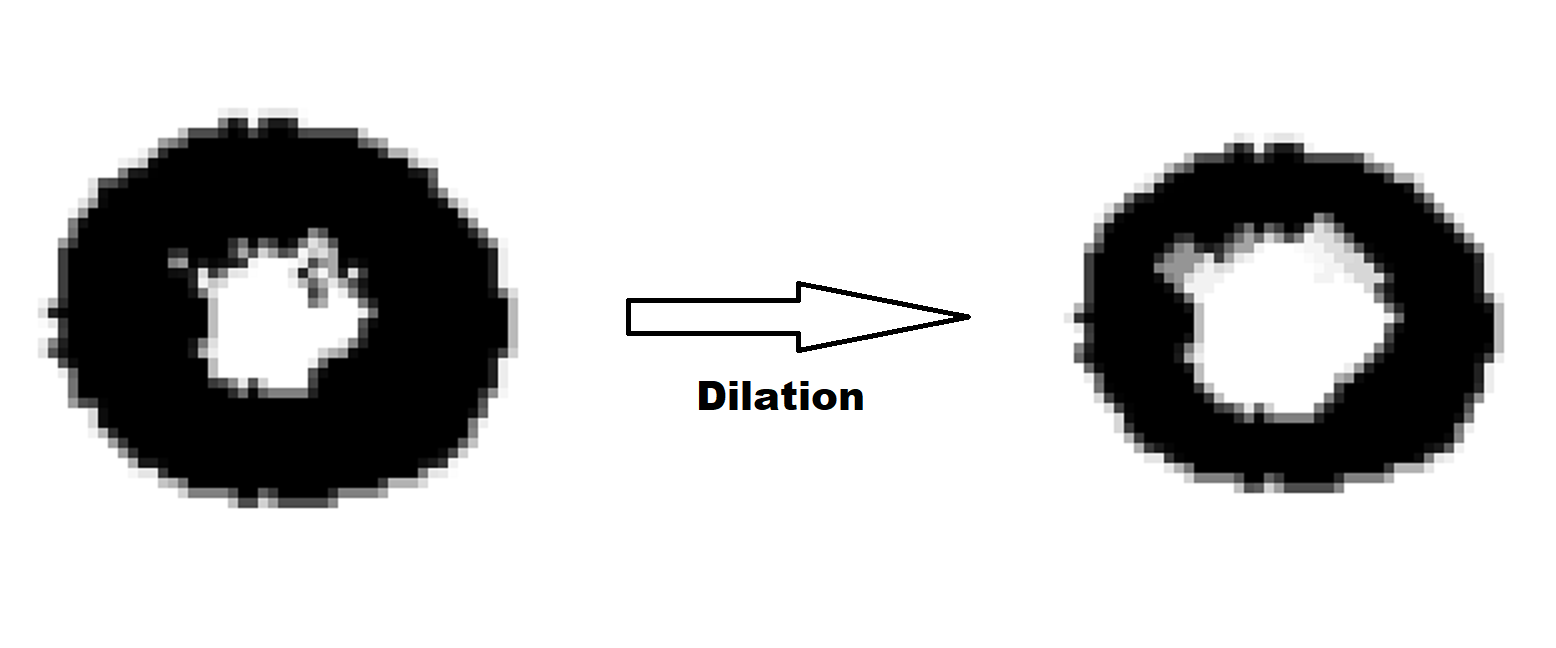
- Note: diamond shaped structuring element illustrated above was used in this dilation operation
- Binary dilation at a pixel coordinate, returns a white pixel (value of 1) if any pixels within the vicinity of the pixel are positive (white); the vicinity is defined by a structuring element
- Grayscale dilation returns the maximum value (brightest pixel) in the vicinity of a pixel coordinate
- Erosion: shrinks objects
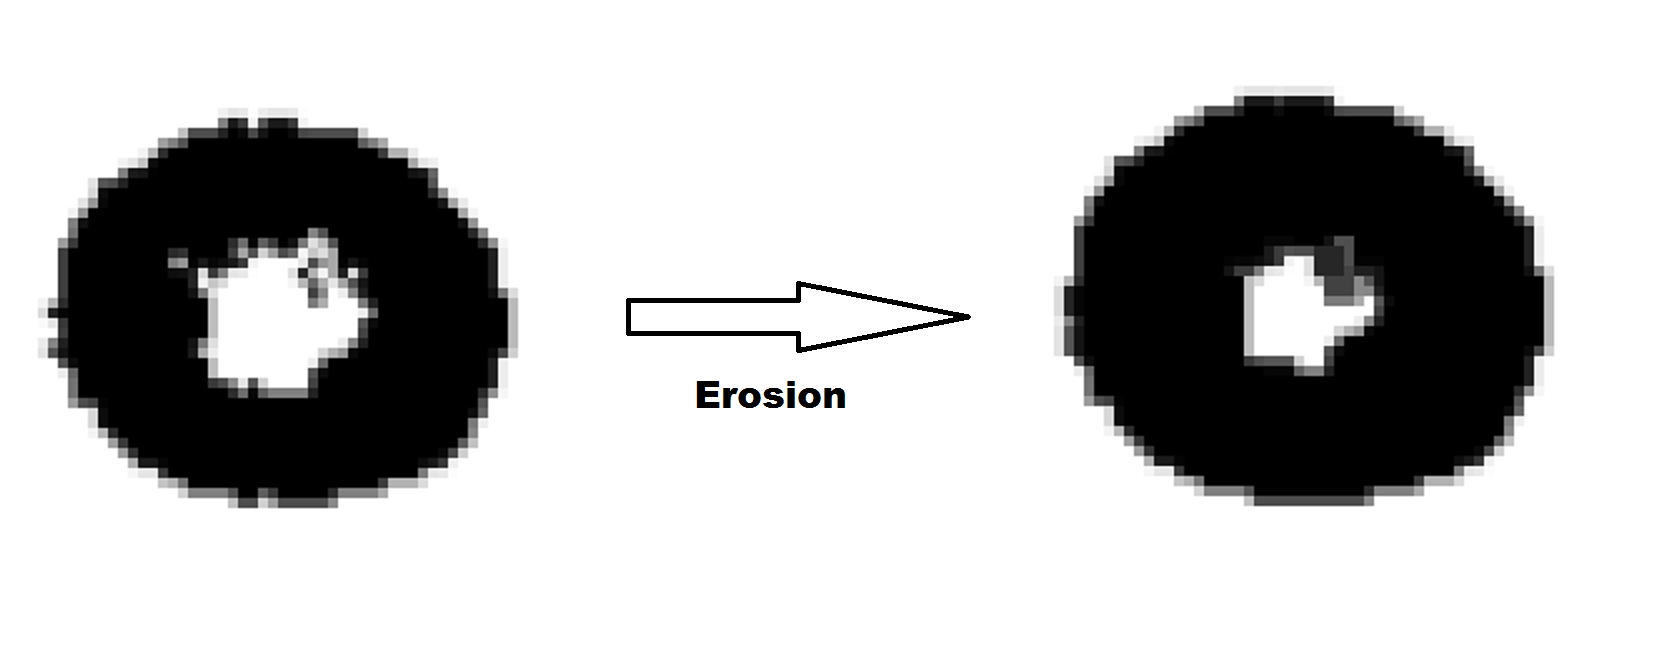
- Binary erosion at a pixel coordinate, returns a black pixel (value of 0) if any pixels within the vicinity of the pixel are zero (black)
- Grayscale erosion returns the minimum value (darkest pixel) in the vicinity of a pixel coordinate
- Opening: erosion followed by dilation
- Closing: dilation followed by erosion
- Dilation: enlarges objects
- Thresholding: excludes colors belonging to a specified range
- Helpful in identifying structures with distinct colors, like nuclei
- ImageJ: image menu → adjust → color threshold
- Below, the nuclei (in a case of clear cell adenocarcinoma) were highlighted using a thresholding operation, facilitating other image analysis procedures like morphometry, counting or segmentation of nuclei

- Edge detection: creates outlines of objects and can facilitate its separation from the surrounding background or other objects
- Convolution matrix: for edge detection, sharpening or blurring
- Most common: 3 x 3 matrix
- GIMP: filter menu → generic → convolution matrix
- Example: applying a 3 x 3 matrix composed of 1s will blur an image

- Normalization: increases the contrast of an image
- Contrast stretching
- Histogram equalization
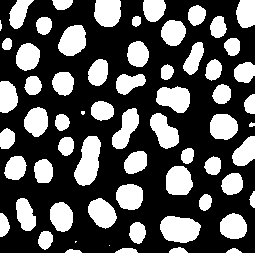
- Watershed algorithm: useful for separating overlapping cells in an image so they can be counted properly
- Contour tracing: draws the boundaries of an object or region of interest
- E.g., drawing an outline around tumor regions to direct a laser microdissection machine to the appropriate regions for operation (J Pathol Inform 2018;9:45)
- Fourier transform: converts an image into a series of 2 dimensional sinusoidal (sine and cosine) waves
- Can be used to remove noise or smoothen an image
- Histogram of oriented gradients (HOG): can extract features from image regions and combine with machine learning methods to identify lesions (Biomed Signal Process Control 2022;74:103530)
- Augmentation: shifting, cropping, rotation, zoom, shear, color shift
- Often used in deep learning to improve model performance and reduce overfitting
- Convolutional neural networks (CNN): became popular in recent years for image classification tasks due to its ease of use, accuracy and increasing availability of computational power needed to run CNN experiments
- Transformers: a type of neural network originally designed for natural language processing; it has recently shown promise in medical image cancer identification, with performance rivaling that of CNNs (Biomed Res Int 2021;2021:6207964)
Applications
- Cell counting
- Mitosis detection
- Cancer / tissue segmentation
- Deep learning methods (J Pathol Inform 2016;7:29)
- Color thresholding
- Edge detection
- Color / texture based (J Pathol Inform 2011;2:13)
- Morphometry: measures the circularity, solidity, shape, volume, size, area and perimeter of objects (example: cells)
- These measurements may be used to train machine learning algorithms to classify objects (example: cells or nuclei)
- Dimensional reduction methods such as PCA or t-SNE can be used to visualize the differences between object classes based on the measurements
- Cancer identification
- Differential diagnosis engine
- Area detection
- Area measurement
- Colocalization: looks for color signals that are close to one another
- Can identify fluorescent signals that originate from the same region / cell
- Object tracking
- Volumetric processing of 3D images (PLoS Biol 2018;16:e2005970)
- Karyotyping
- Serum protein electrophoresis (SPEP) densitometry plot intensity measurement (Electrophoresis 2013;34:1148)
- Optical character recognition (OCR)
- Automatically extract text from images and scanned documents, which can save time compared to manual transcription (Gastrointest Endosc 2021;93:750)
Tools
- ImageJ
- GNU Image Manipulation Program (GIMP)
- Matlab / Octave
- Open Source Computer Vision Library (OpenCV): has interfaces for C++, Python and Java
- Scikit-image: Python image processing library
- OpenSlide: can extract image regions from several digital slide formats; libraries are available for C++ and Python
- CellProfiler: for cell morphometry, can extract numerous cell / nuclei features, which may be used for statistical analysis / machine learning with CellProfiler Analyst or other machine learning software
- Ilastik: interactivate segmentation and classification software where the user labels positive regions by drawing on them
- Stardist: Python object detection library, has Tensorflow dependency
Board review style question #1
Which image processing method can separate overlapping red blood cells?
- Grayscale operation
- Histogram equalization
- Rotation
- Watershed
Board review style answer #1
Board review style question #2
Which image processing technique can increase contrast in an image?
- Closing
- Dilation
- Histogram equalization
- Watershed
Board review style answer #2